Building an Event Analytics Pipeline with Confluent Cloud and Imply Polaris
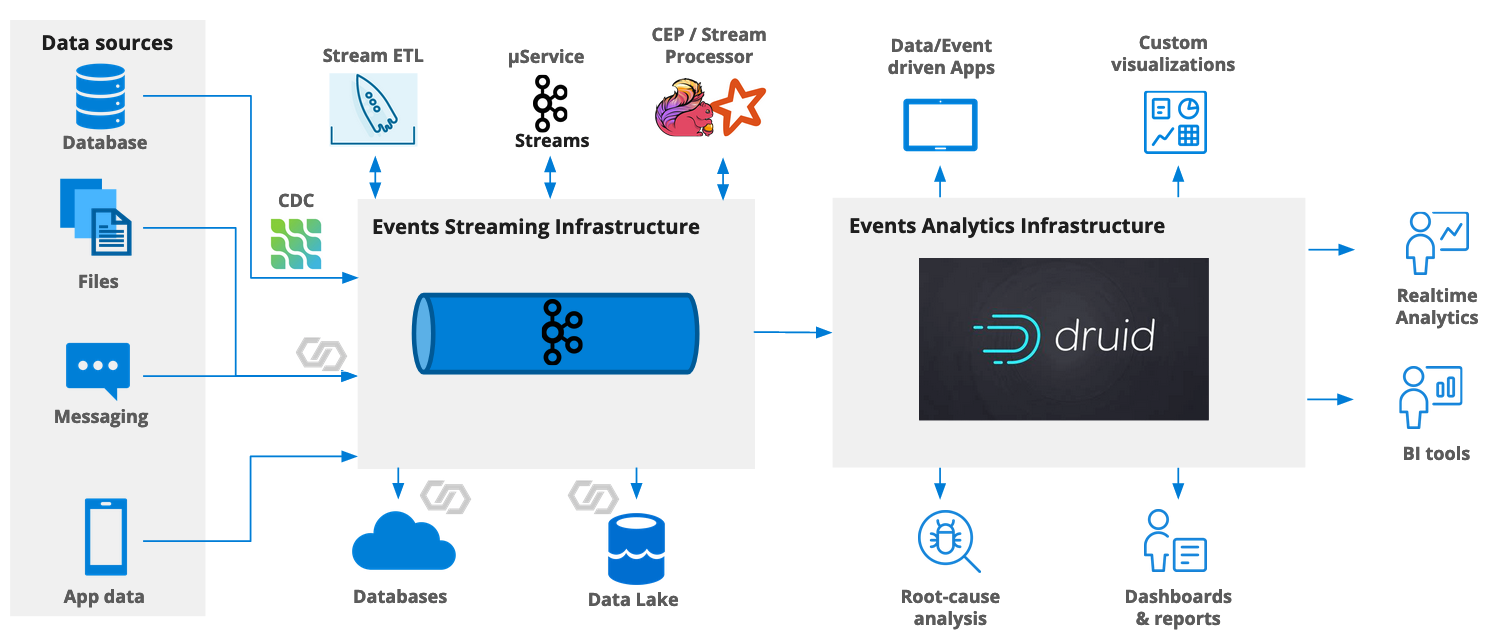
A modern streaming analytics pipeline is built around two central components:
- an event streaming platform
- an event analytics platform.
This is conveniently achieved using Confluent Cloud as a SaaS event streaming platform, and Imply Polaris as a SaaS realtime analytics database.
In this blogpost, I am going to show you how to set up a pipeline that
- generates a simulated clickstream event stream and sends it to Confluent Cloud
- processes the raw clickstream data using managed ksqlDB in Confluent Cloud
- delivers the processed stream using Confluent Cloud
- ingests these JSON events, using a native connection, into Imply Polaris
- and visualizes the event data in a dashboard.
All this, only with a few clicks and some SQL!
But first, let’s cover some of the basics.
The Case for Streaming Analytics
Old School Analytics
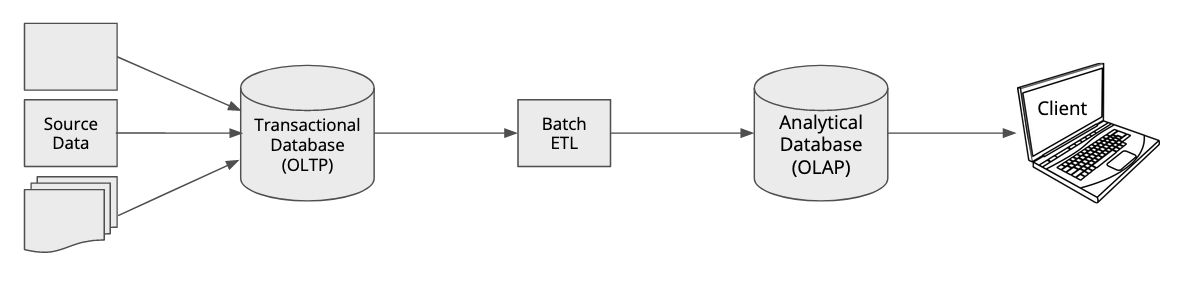
This is how we used to do analytics, roughly 20 years ago. You would have your operational systems that collected data into transactional, or OLTP, databases.
OLTP databases are built to process single updates or inserts very quickly. In traditional relational modeling this means you have to normalize your data model, ideally to a point where each item exists only once in a database. The downside is when you want to run an analytical query that aggregates data from different parts of your database, these queries require complex joins and can become very expensive, hurting query times and interfering with the transactional performance of your database.
Hence another type of databases was conceived which is optimized for these analytical queries: OLAP databases. These come in different shapes and flavors, but generally a certain amount of denormalization and possibly preaggregation is applied to the data.
The process that ships data from the transactional system to the OLAP database is called ETL - Extract, Transform, Load. It is a batch process that would run on a regular basis, for instance once a night or once every week. The frequency of the batch process determines how “fresh” your analytical data is.
In the old world, where analytical users would be data analysts inside the enterprise itself, that was often good enough. But nowadays, in the age of connectivity, everyone is an analytics user. If you check your bank account balance and the list of transactions in your banking app on your smartphone, you are an analytics user. And if someone transfers funds to your account, you expect to see the result now and not two days later.
A better way of processing data for analytics was needed. And we’ll look at that now.
Big Data and the Lambda Architecture
About ten years ago, the big data craze came up around the Hadoop ecosystem. Hadoop brought with it the ability to handle historical data to a previously unknown scale, but it also already had real time1 capability, with tooling like Kafka, Flume, and HBase.
The first approach to getting analytics more up to date was the so called lambda architecture, where incoming data would be sent across two parallel paths:
- A realtime layer with low latency and limited analytical capabilities
- A highly scalable but slower batch layer.

This way, you would be able to retrieve at least some of the analytics results immediately, and get the full results the next day.
A common serving layer would be the single entry point for clients.
This architectural pattern did the job for a while but it has an intrinsic complexity that is somewhat hard to master. Also, when you have two different sources of results, you need to go through an extra effort to make sure that the results always match up.
Kappa Architecture
A better way needed to be found. It was created in the form of the kappa architecture. In the kappa architecture, there is only one data path and only one result for a given query. The same processing path gives (near) real time results and also fills up the storage for historical data.

The kappa architecture handles incoming streaming data and historical data in a common, uniform way and is more robust than a lambda architecture. Ideally you still want to encapsulate the details of such an architecture and not concern the user with it. We will come to that in a moment.
Implementing the Kappa Architecture: Druid
Apache Druid is a high performance, real-time analytics database purpose-built for powering analytics applications at massive scale and concurrency on streaming and batch data.
Druid encapsulates the kappa architecture so you don’t need to bother about all the implementation detail. Here is a quick, high level overview of the components that make up a Druid instance.
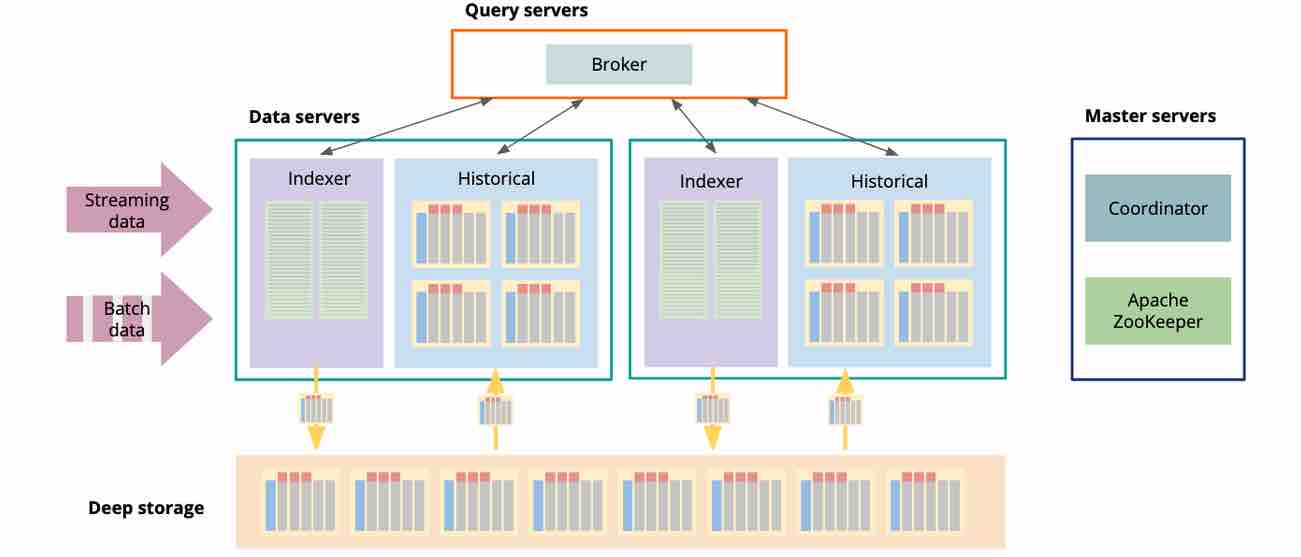
Druid is heavily distributed and exceptionally scalable, and here is how that works.
In Druid, there are three type of servers: master, query, and data servers. Also there is deep storage (typically object storage, such as S3), and a relational database for metadata.
Master servers handle data coordination, metadata processing, and service discovery. They know which bit of data lives where in the Druid cluster, and which processes and compute resources are available.
Query servers serve as the entry point for clients. They receive a query, chop it up into partial queries that can be handled by a single machine independently, and assign each partial query to a process on a data server. When the partial results come back, the query server assembles them, applies final processing such as sorting and aggregations, and returns the result to the caller.
The heavy lifting is mostly done by machines called data servers. A data server handles both data ingestion and partial queries.
Let’s look at streaming ingestion. An indexer process consumes data directly from a Kafka stream. These data are stored in memory as a realtime segment. They are already queryable. When a configurable time interval has been passed, the segment is closed off and a new segment is started. The finished segment is transformed into a columnar format. Within the segment, data is ordered by time. All alphanumeric data are dictionary compressed and bitmap indexed. The final result is binary compressed again, and written to deep storage. Deep storage serves as an archive and the source of truth.
From deep storage, segments are then loaded to the local storage of the data servers, typically twice replicated for resiliency and performance. Then they are available for querying by the historical processes.
A query’s result is collected from the realtime segments (via the indexers) and the historical segments. This encapsulates the kappa architecture and hides most of its detail from the database user.
Imply Polaris: Druid as a Service
Imply Polaris is a cloud based database-as-a-service based on Druid. Polaris is completely managed and offers a unified GUI and API to ingest, manage, and analyze your data. It can natively read from message streams with minimal configuration, and offers a built-in frontend for adhoc analytics, dashboarding and alerting.
I will be using Polaris as the analytics database in this tutorial.
Preparing your Data: Streaming ETL
We also need to concern ourselves with getting the data out of the transactional systems into our analytics architecture - the ETL part.
Instead of processing batches of data, streaming ETL has to be event driven. There are two ways of processing event data in a streaming ETL pipeline:
- Simple event processing looks at one event at a time. Simple event processing is stateless which makes it easy to implement but limite the things you can do with it. This is used for format transformations, filtering, or data cleansing, for instance. An example for simple event processing is Apache NiFi.
- Complex event processing looks at a collection of events over time, hence it is stateful and has to maintain a state store in the background. With that you can do things like windows aggregations, such as sliding averages or session aggregations. You can also join various event streams (think orders and shipments), or enrich data with lookup data that is itself event based. Complex event processing is possible using frameworks like Spark Streaming, Flink, or Kafka Streams.
In this tutorial, I will use Confluent Cloud for data delivery, and ksqlDB for streaming ETL. ksqlDB is a community licensed SQL framework on top of Kafka Streams, by Confluent. It is also available as a managed offering in Confluent Cloud, and that is what I will be using.
With ksqlDB, you can write a complex event streaming application as simple SQL statements. ksqlDB queries are typically persistent: unlike database queries, they continue running until they are explicitly stopped, and they continue to emit new events as they process new input events in real time. ksqlDB abstracts away for the most part the detail of event and state handling.
High-Level Architecture
So, here’s the plan:
- Use Confluent Cloud (based on Kafka) for delivery
- For streaming ETL, use ksqlDB - also in Confluent Cloud
- ksqlDB will play data back into a Kafka topic
- Use Imply Polaris’s built in Confluent Cloud connectivity to ingest the preprocessed data into Polaris.
Prerequisites
For this tutorial, you need a Confluent Cloud account. In this account, create an environment, a cluster, and a ksqlDB application.
The smallest size of cluster (Basic) will do.
Furthermore, you need an Imply Polaris environment. You can sign up for a free trial here.
Data Generation
I am using the imply-news data generator. It simulates clickstream data from a news publisher portal. You can find setup instructions in the repository if you want to run this yourself.
Here is a sample of the data:
{"timestamp": 1673512817.517501, "recordType": "click", "url": "https://imply-news.com/home/Sport/Step-left-list-discuss-up", "useragent": "Mozilla/5.0 (Windows; U; Windows NT 10.0) AppleWebKit/531.19.5 (KHTML, like Gecko) Version/5.0.5 Safari/531.19.5", "statuscode": "200", "state": "home", "statesVisited": ["home", "content", "content", "home"], "sid": 14362070, "uid": "86525", "isSubscriber": 0, "campaign": "fb-2 US Election", "channel": "display", "contentId": "Sport", "subContentId": "Step left list discuss up", "gender": "w", "age": "51-60", "latitude": "45.47885", "longitude": "133.42825", "place_name": "Lesozavodsk", "country_code": "RU", "timezone": "Asia/Vladivostok"}
{"timestamp": 1673512817.5246856, "recordType": "click", "url": "https://imply-news.com/affiliateLink/News/Argue-Congress-beautiful-go-usually-which-brother", "useragent": "Opera/9.37.(Windows CE; mni-IN) Presto/2.9.171 Version/11.00", "statuscode": "200", "state": "affiliateLink", "statesVisited": ["home", "affiliateLink"], "sid": 14357239, "uid": "59450", "isSubscriber": 0, "campaign": "fb-2 US Election", "channel": "social media", "contentId": "News", "subContentId": "Argue Congress beautiful go usually which brother", "gender": "w", "age": "26-35", "latitude": "4.96667", "longitude": "10.7", "place_name": "Tonga", "country_code": "CM", "timezone": "Africa/Douala"}
{"timestamp": 1673512730.502167, "recordType": "session", "useragent": "Mozilla/5.0 (compatible; MSIE 7.0; Windows NT 6.2; Trident/5.1)", "statesVisited": ["home", "exitSession"], "sid": 14333040, "uid": "74108", "isSubscriber": 1, "campaign": "fb-2 US Election", "channel": "social media", "gender": "m", "age": "26-35", "latitude": "-33.59217", "longitude": "-70.6996", "place_name": "San Bernardo", "country_code": "CL", "timezone": "America/Santiago", "home": 1, "content": 0, "clickbait": 0, "subscribe": 0, "plusContent": 0, "affiliateLink": 0, "exitSession": 1}
{"timestamp": 1673512817.5646698, "recordType": "click", "url": "https://imply-news.com/home/Sport/Unit-down-perform-religious-add-find-management", "useragent": "Mozilla/5.0 (Linux; Android 2.3.2) AppleWebKit/532.1 (KHTML, like Gecko) Chrome/34.0.876.0 Safari/532.1", "statuscode": "200", "state": "home", "statesVisited": ["home"], "sid": 14370083, "uid": "81655", "isSubscriber": 0, "campaign": "fb-2 US Election", "channel": "paid search", "contentId": "Sport", "subContentId": "Unit down perform religious add find management", "gender": "w", "age": "36-50", "latitude": "41.66394", "longitude": "-83.55521", "place_name": "Toledo", "country_code": "US", "timezone": "America/New_York"}
{"timestamp": 1673512817.5769033, "recordType": "click", "url": "https://imply-news.com/exitSession/Puzzle/Resource-within-author-can", "useragent": "Mozilla/5.0 (Android 5.0.2; Mobile; rv:62.0) Gecko/62.0 Firefox/62.0", "statuscode": "200", "state": "exitSession", "statesVisited": ["home", "content", "clickbait", "plusContent", "plusContent", "home", "exitSession"], "sid": 14345138, "uid": "72517", "isSubscriber": 0, "campaign": "fb-2 US Election", "channel": "social media", "contentId": "Puzzle", "subContentId": "Resource within author can", "gender": "m", "age": "51-60", "latitude": "37.60876", "longitude": "-77.37331", "place_name": "Mechanicsville", "country_code": "US", "timezone": "America/New_York"}
You can see that we have different kinds of objects in this topic, distinguished by the recordType field. These have different type and number of fields, which means we cannot just slurp up everything using off-the-shelf JSON ingestion.
(Why would you have different objects in a topic in a real life scenario? This blog discusses some of the reasons and the decision criteria.)
The ETL Pipeline
Let’s set up a basic ETL pipeline. We have two tasks:
- We need to filter the raw data, retaining only the records that have type
click. - Once we have a uniform structure, we want to filter out only records that originate from a specific country.
Here’s the overview in a chart:
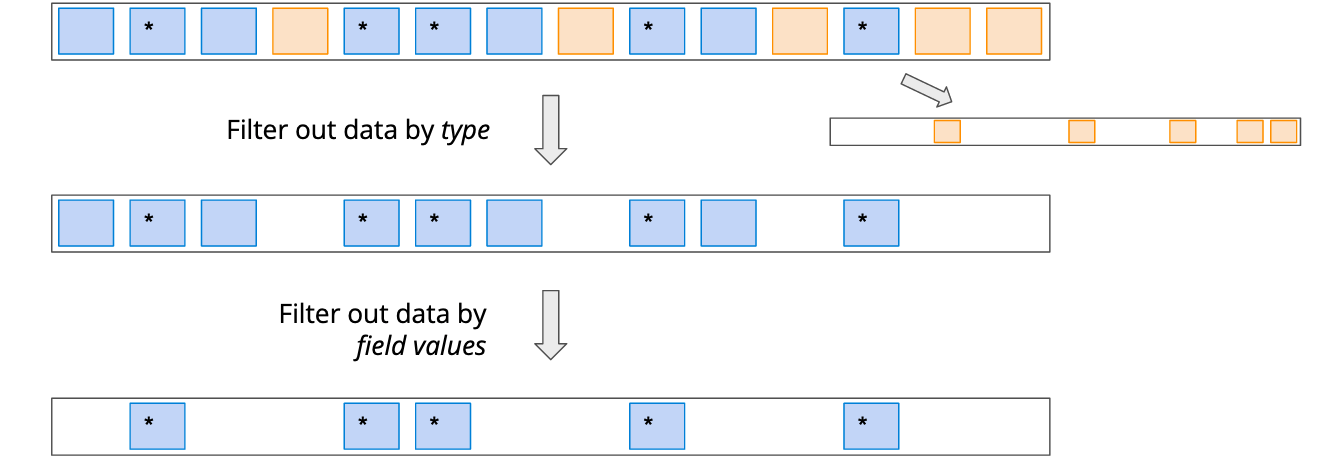
The chart also suggests that we are going to need a total of three topics:
- The original topic
imply-news - A topic that contains all click data
- A topic that contains only filtered click data.
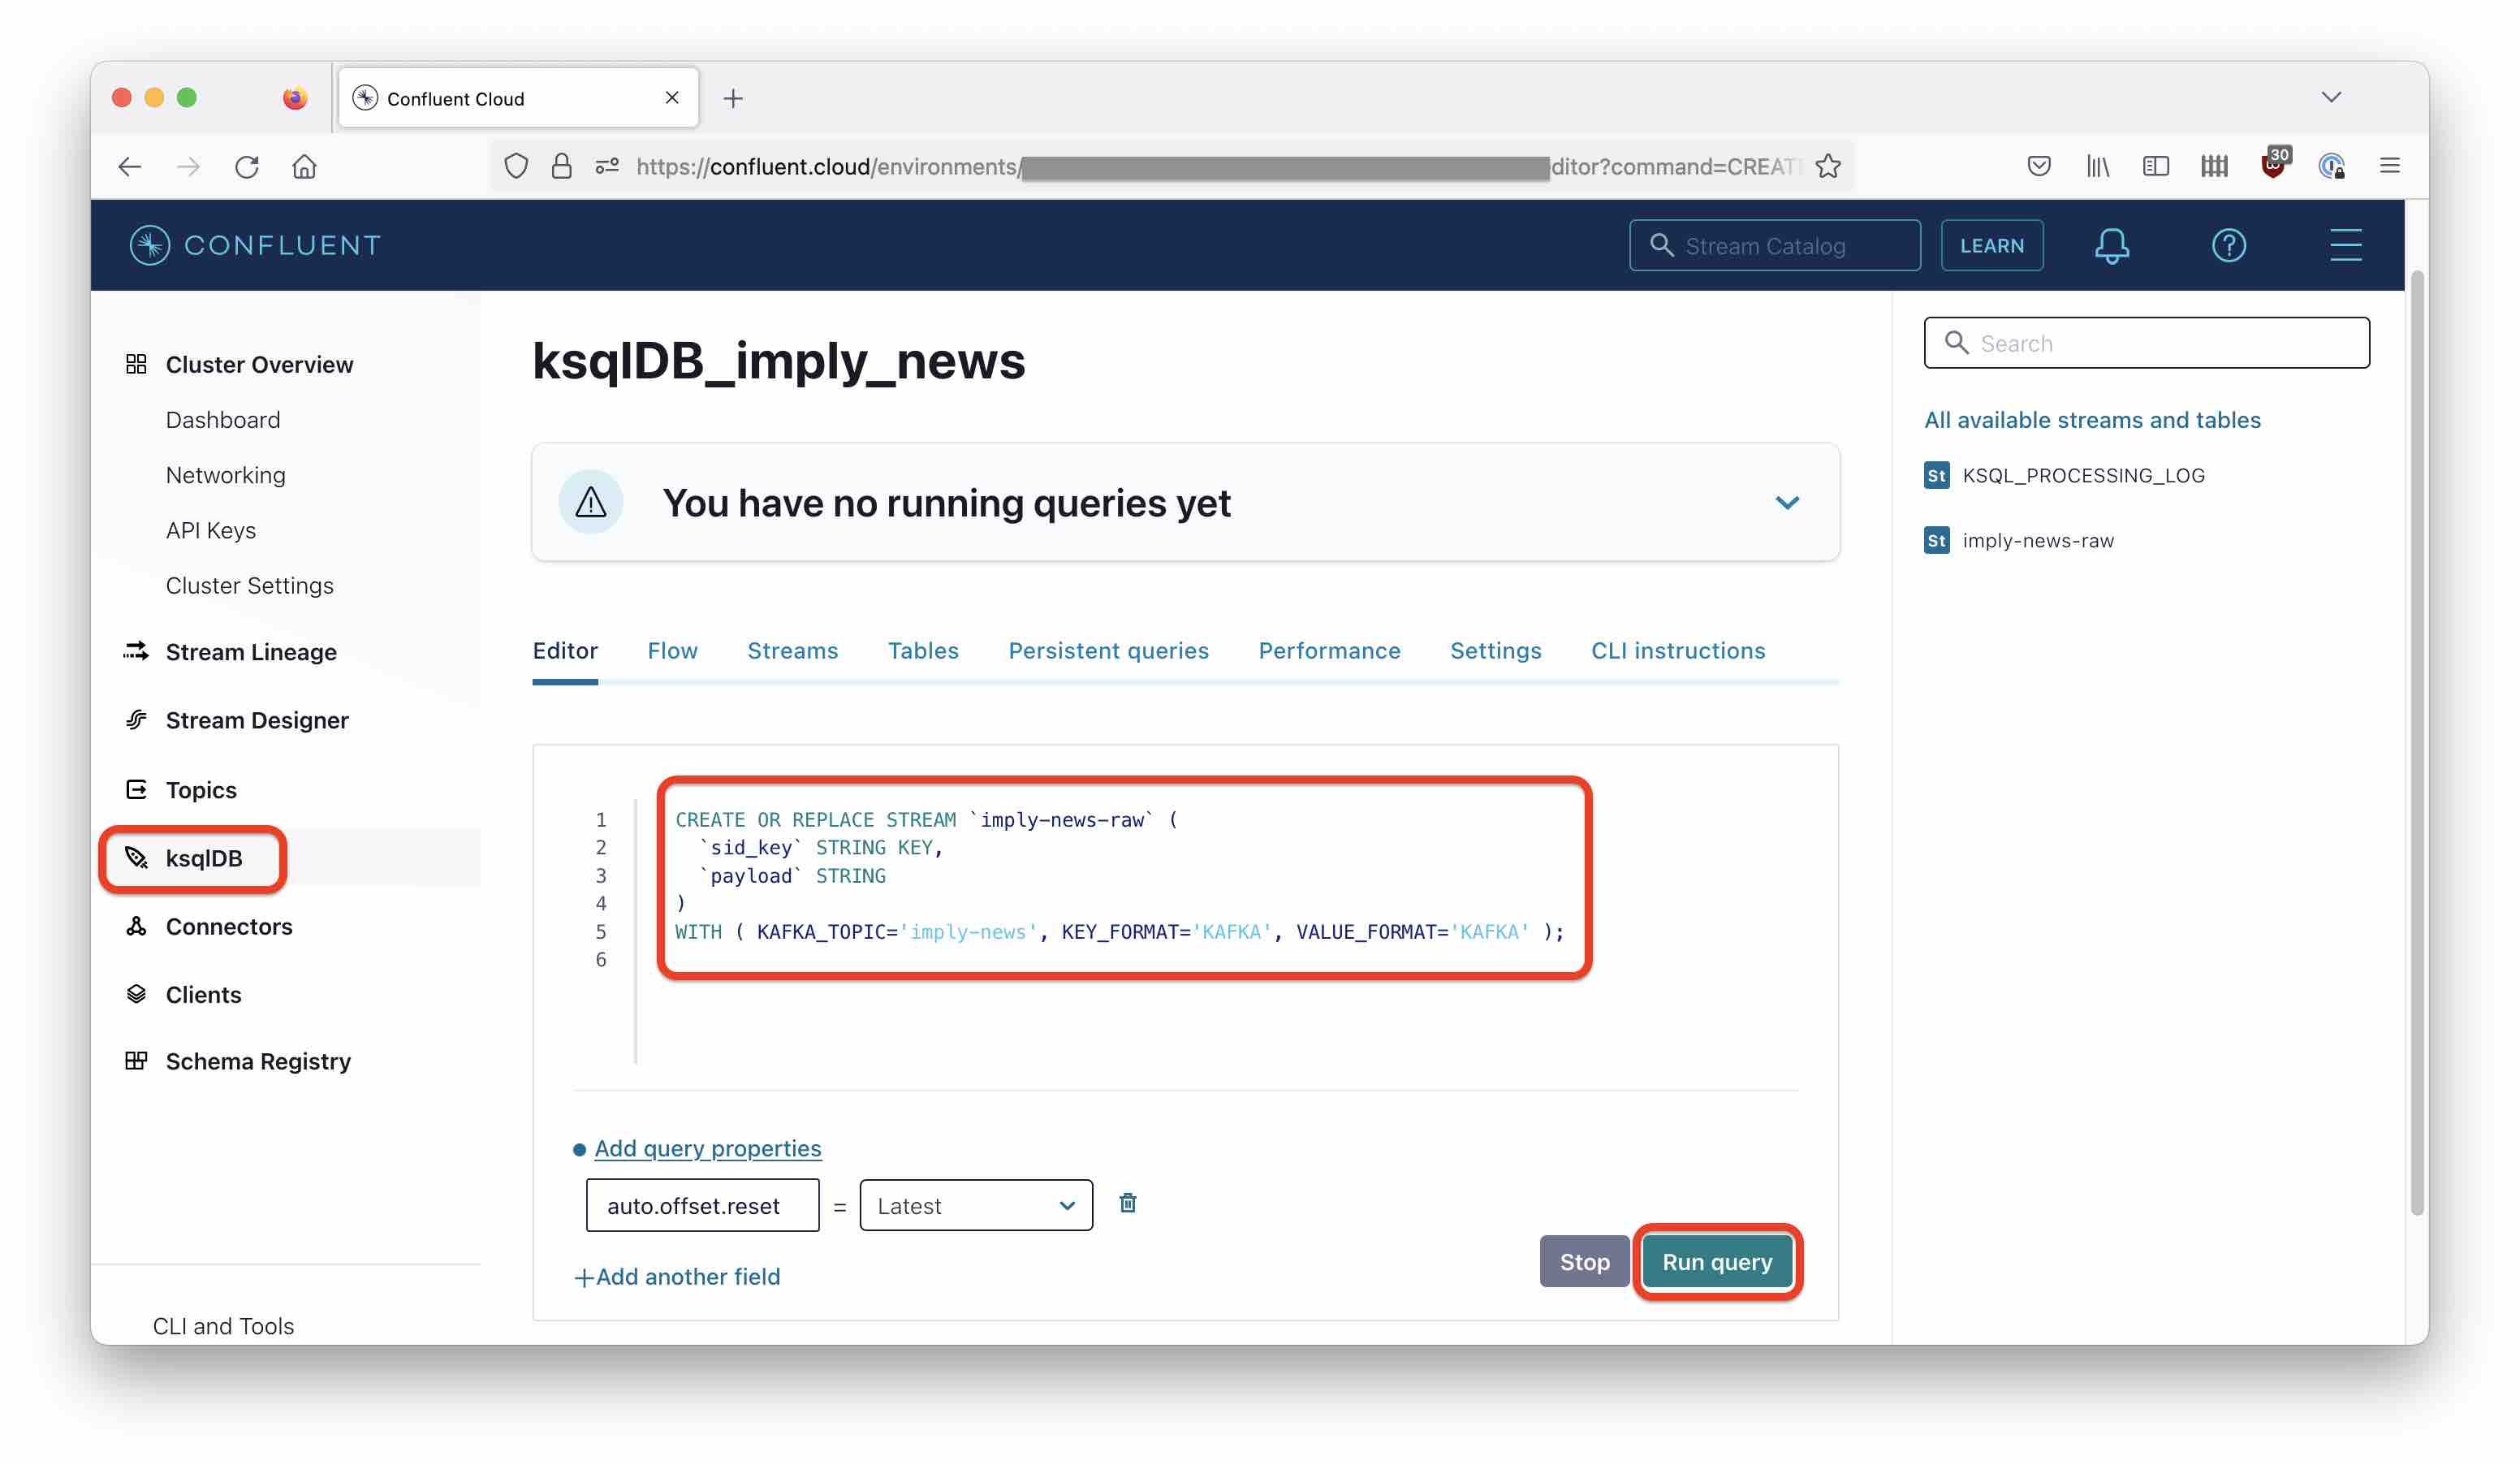
We are going run some ksqlDB queries to achieve this. You can enter the queries directly into the ksqlDB editor in Confluent Cloud:
Creating a Stream
ksqlDB uses abstractions on top of Kafka topics: Streams and Tables. You can imagine Streams as describing a change log, and Tables as describing the last known state. For this tutorial, we will work with Streams only.
Let’s create a stream on top of the original topic. Because we have different types of objects, we have to treat the incoming events as unstructured data for now. We do this by specifying VALUE_FORMAT='KAFKA' in the statement, which interprets the data as a sequence of bytes without further assumptions:
CREATE OR REPLACE STREAM `imply-news-raw` (
  `sid_key` STRING KEY,
  `payload` STRING
)
WITH ( KAFKA_TOPIC='imply-news', KEY_FORMAT='KAFKA', VALUE_FORMAT='KAFKA' );
This does not create any jobs or new topics yet!
Split by Type
Now let’s implement the topic splitter. We will only retain records with type ‘click’. This is one way to splice up a topic that has different types of records. Data is still regarded as a blob and the splicing criteria is extracted with an explicit JSON function:
CREATE OR REPLACE STREAM `imply-news-clicks` WITH (
  KAFKA_TOPIC='imply-news-clicks',
  PARTITIONS=6,
  KEY_FORMAT='KAFKA',
  VALUE_FORMAT='KAFKA' ) AS
SELECT
  `sid_key`,
  `payload`
FROM `imply-news-raw`
WHERE EXTRACTJSONFIELD(`payload`, '$.recordType') = 'click';
While this statement looks similar to the first one, it does something very different: The idiom CREATE STREAM ... AS SELECT creates a new push query and a new topic to receive the result. Unlike a regular (pull) query, the push query continues to run and to produce new output for every input event!
Viewed another way, by issuing this statement you have just deployed a realtime streaming application!
From Unstructured to Structured Data
Now let’s reinterpret the cleansed data as structured JSON records. This is another CREATE STREAM statement that, like the first one, does not spawn a new process. But the VALUE_FORMAT is now JSON and we specify the fields for our record type explicitly. (There are more elegant ways to do this using the Schema Registry, but that is another story for another time.)
CREATE OR REPLACE STREAM `imply-news-cooked` (
  `sid_key` STRING KEY,
  `sid` STRING,
  `timestamp` BIGINT,
  `recordType` STRING,
  `url` STRING,
  `useragent` STRING,
  `statuscode` STRING,
  `state` STRING,
  `uid` STRING,
  `isSubscriber` INT,
  `campaign` STRING,
  `channel` STRING,
  `contentId` STRING,
  `subContentId` STRING,
  `gender` STRING,
  `age` STRING,
  `latitude` DOUBLE,
  `longitude` DOUBLE,
  `place_name` STRING,
  `country_code` STRING,
  `timezone` STRING
)
WITH ( KAFKA_TOPIC='imply-news-clicks', KEY_FORMAT='KAFKA', VALUE_FORMAT='JSON' );
Filtering the Data
And finally, let’s do a minimalistic example of further processing by filtering out only click events that originate from Germany, creating another push query and a new topic:
CREATE OR REPLACE STREAM `imply-news-de` WITH (
  KAFKA_TOPIC='imply-news-de',
  KEY_FORMAT='KAFKA',
  VALUE_FORMAT='JSON' ) AS
SELECT *
FROM `imply-news-cooked`
WHERE `country_code` = 'DE';
Here’s where you would apply any other filtering, massaging, joining, or whatever you would do in an ETL process. But let’s leave Confluent Cloud for now, and move on the the next step.
Ingesting the Data into Polaris
In Polaris, create a new source using Confluent Cloud as the input:
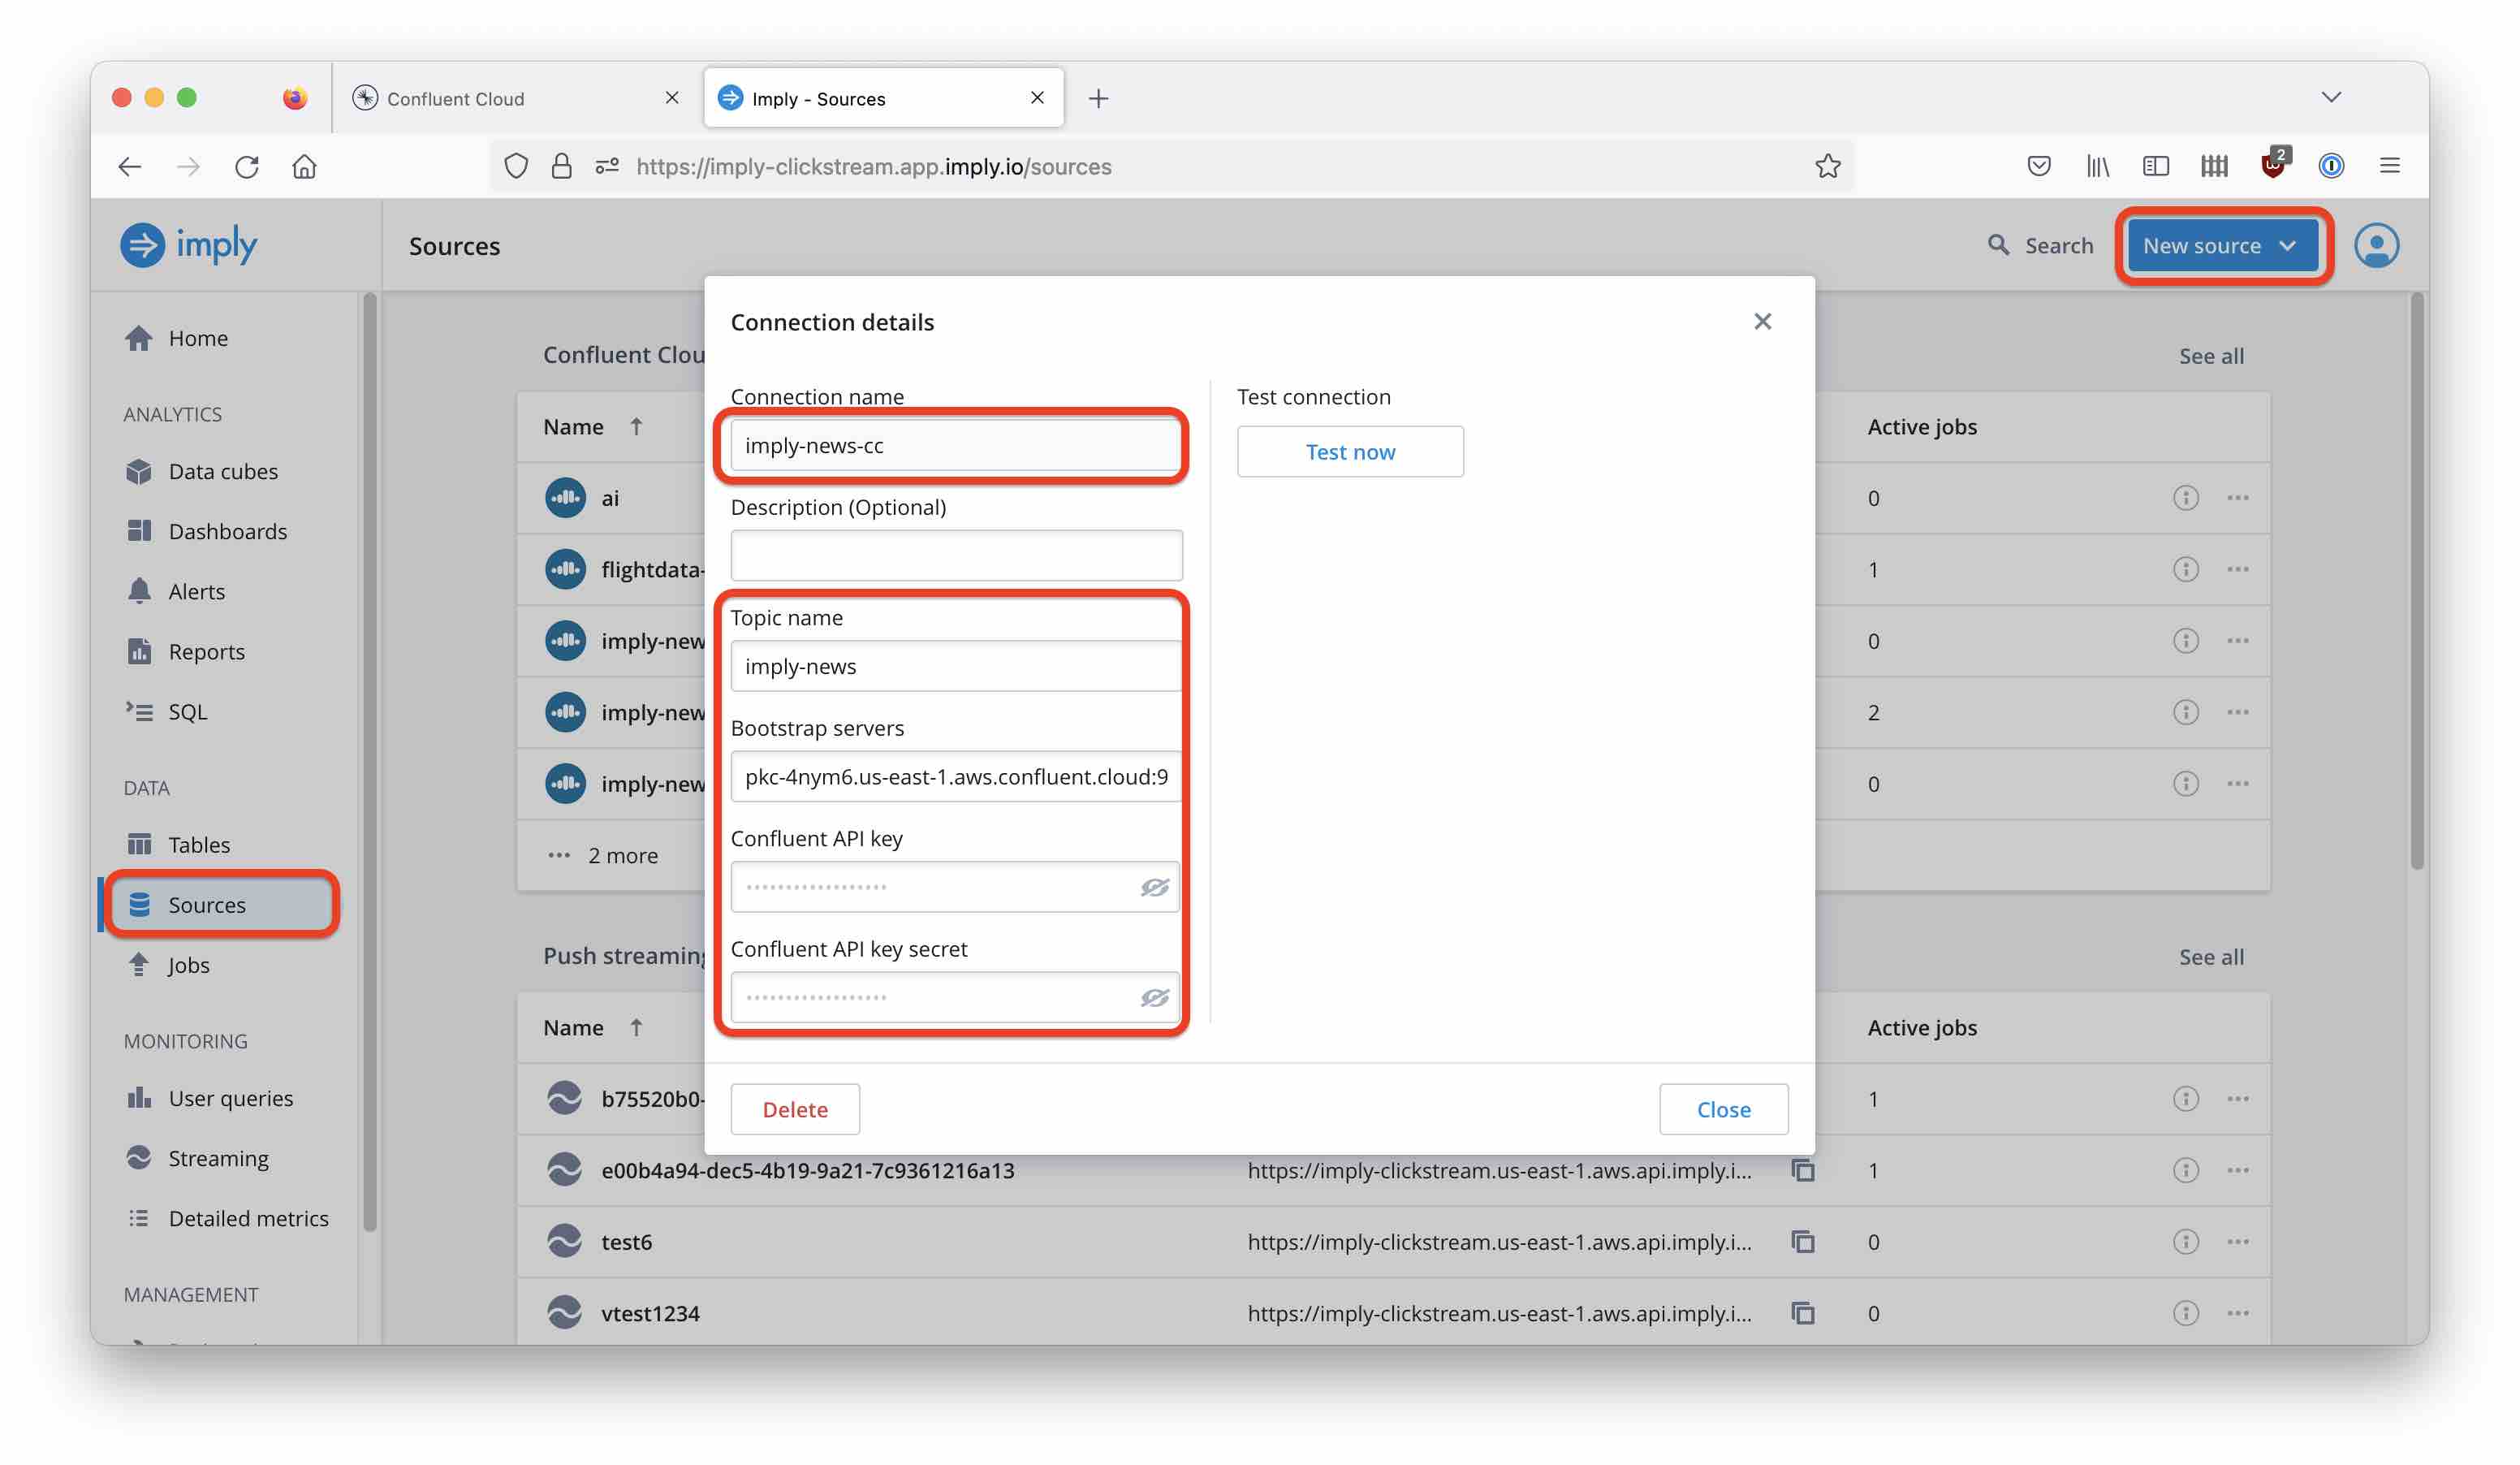
You will need your Confluent Cloud broker URL and credentials. How to acquire these, I have covered this in more detail in this post. There is a Test button to verify that the connection is working.
Once you are done, navigate to the Tables menu and create a new table:
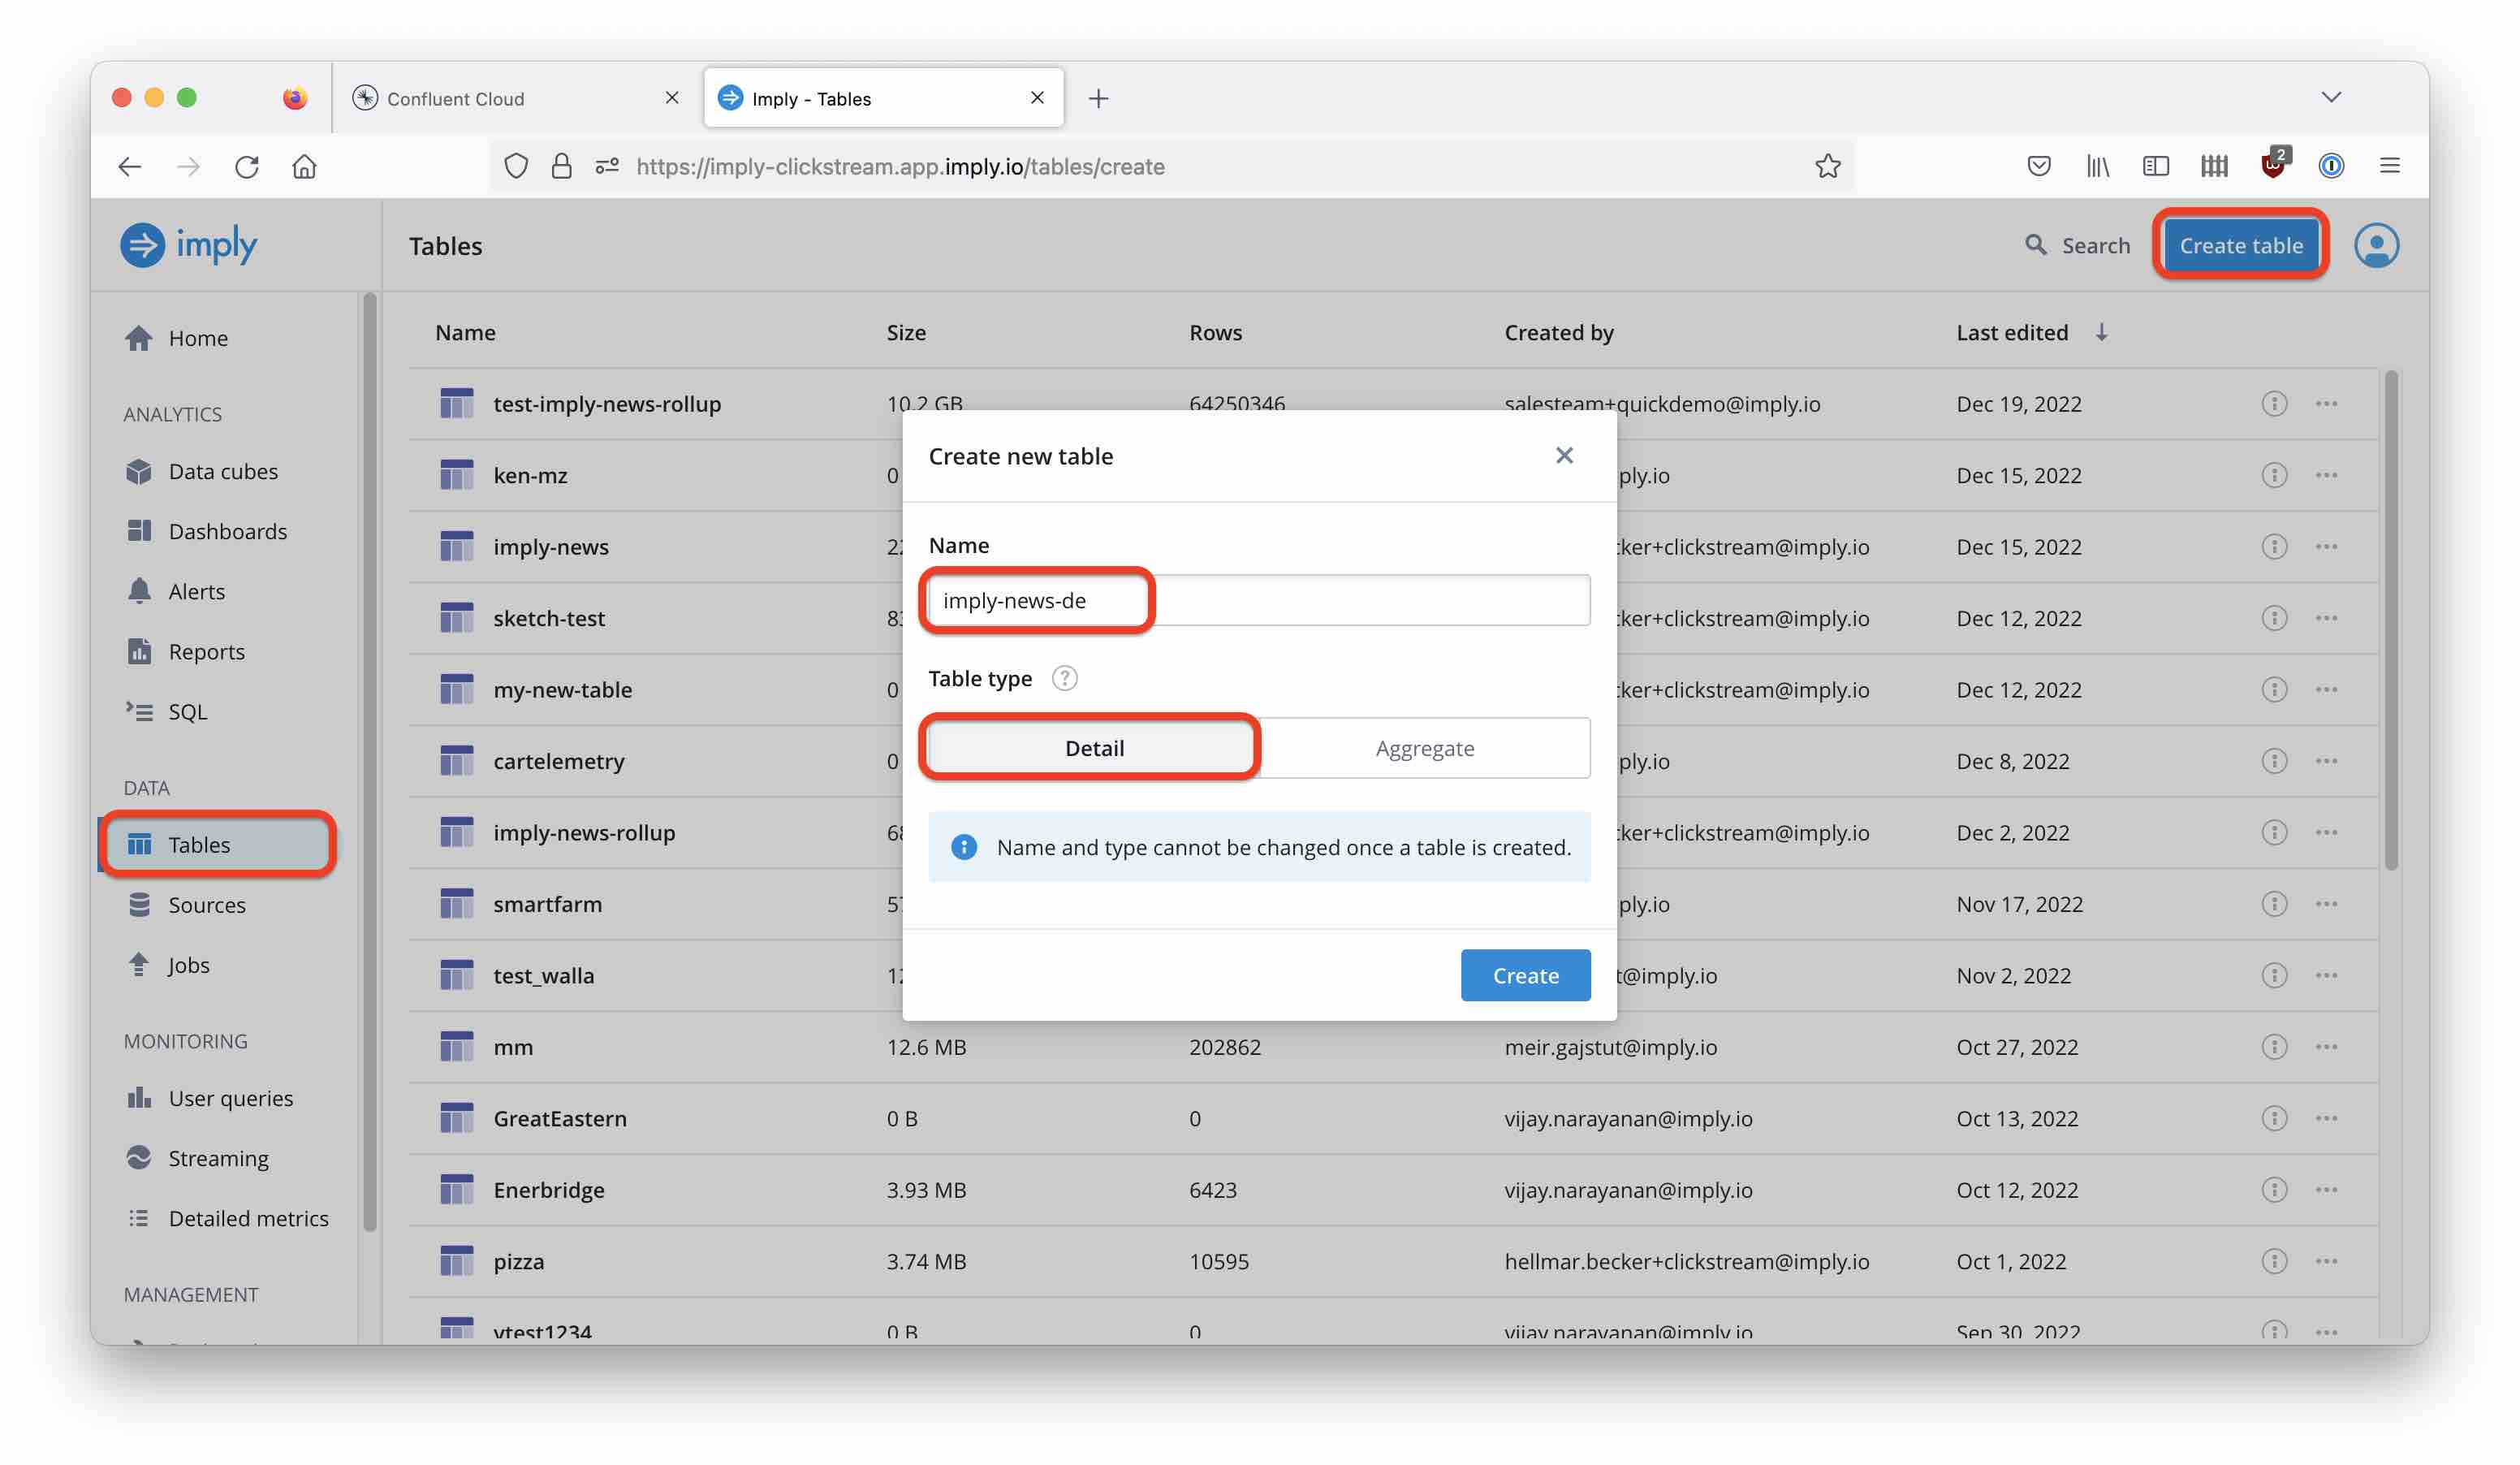
Follow the documentation to set up the table schema based on your newly created connection:
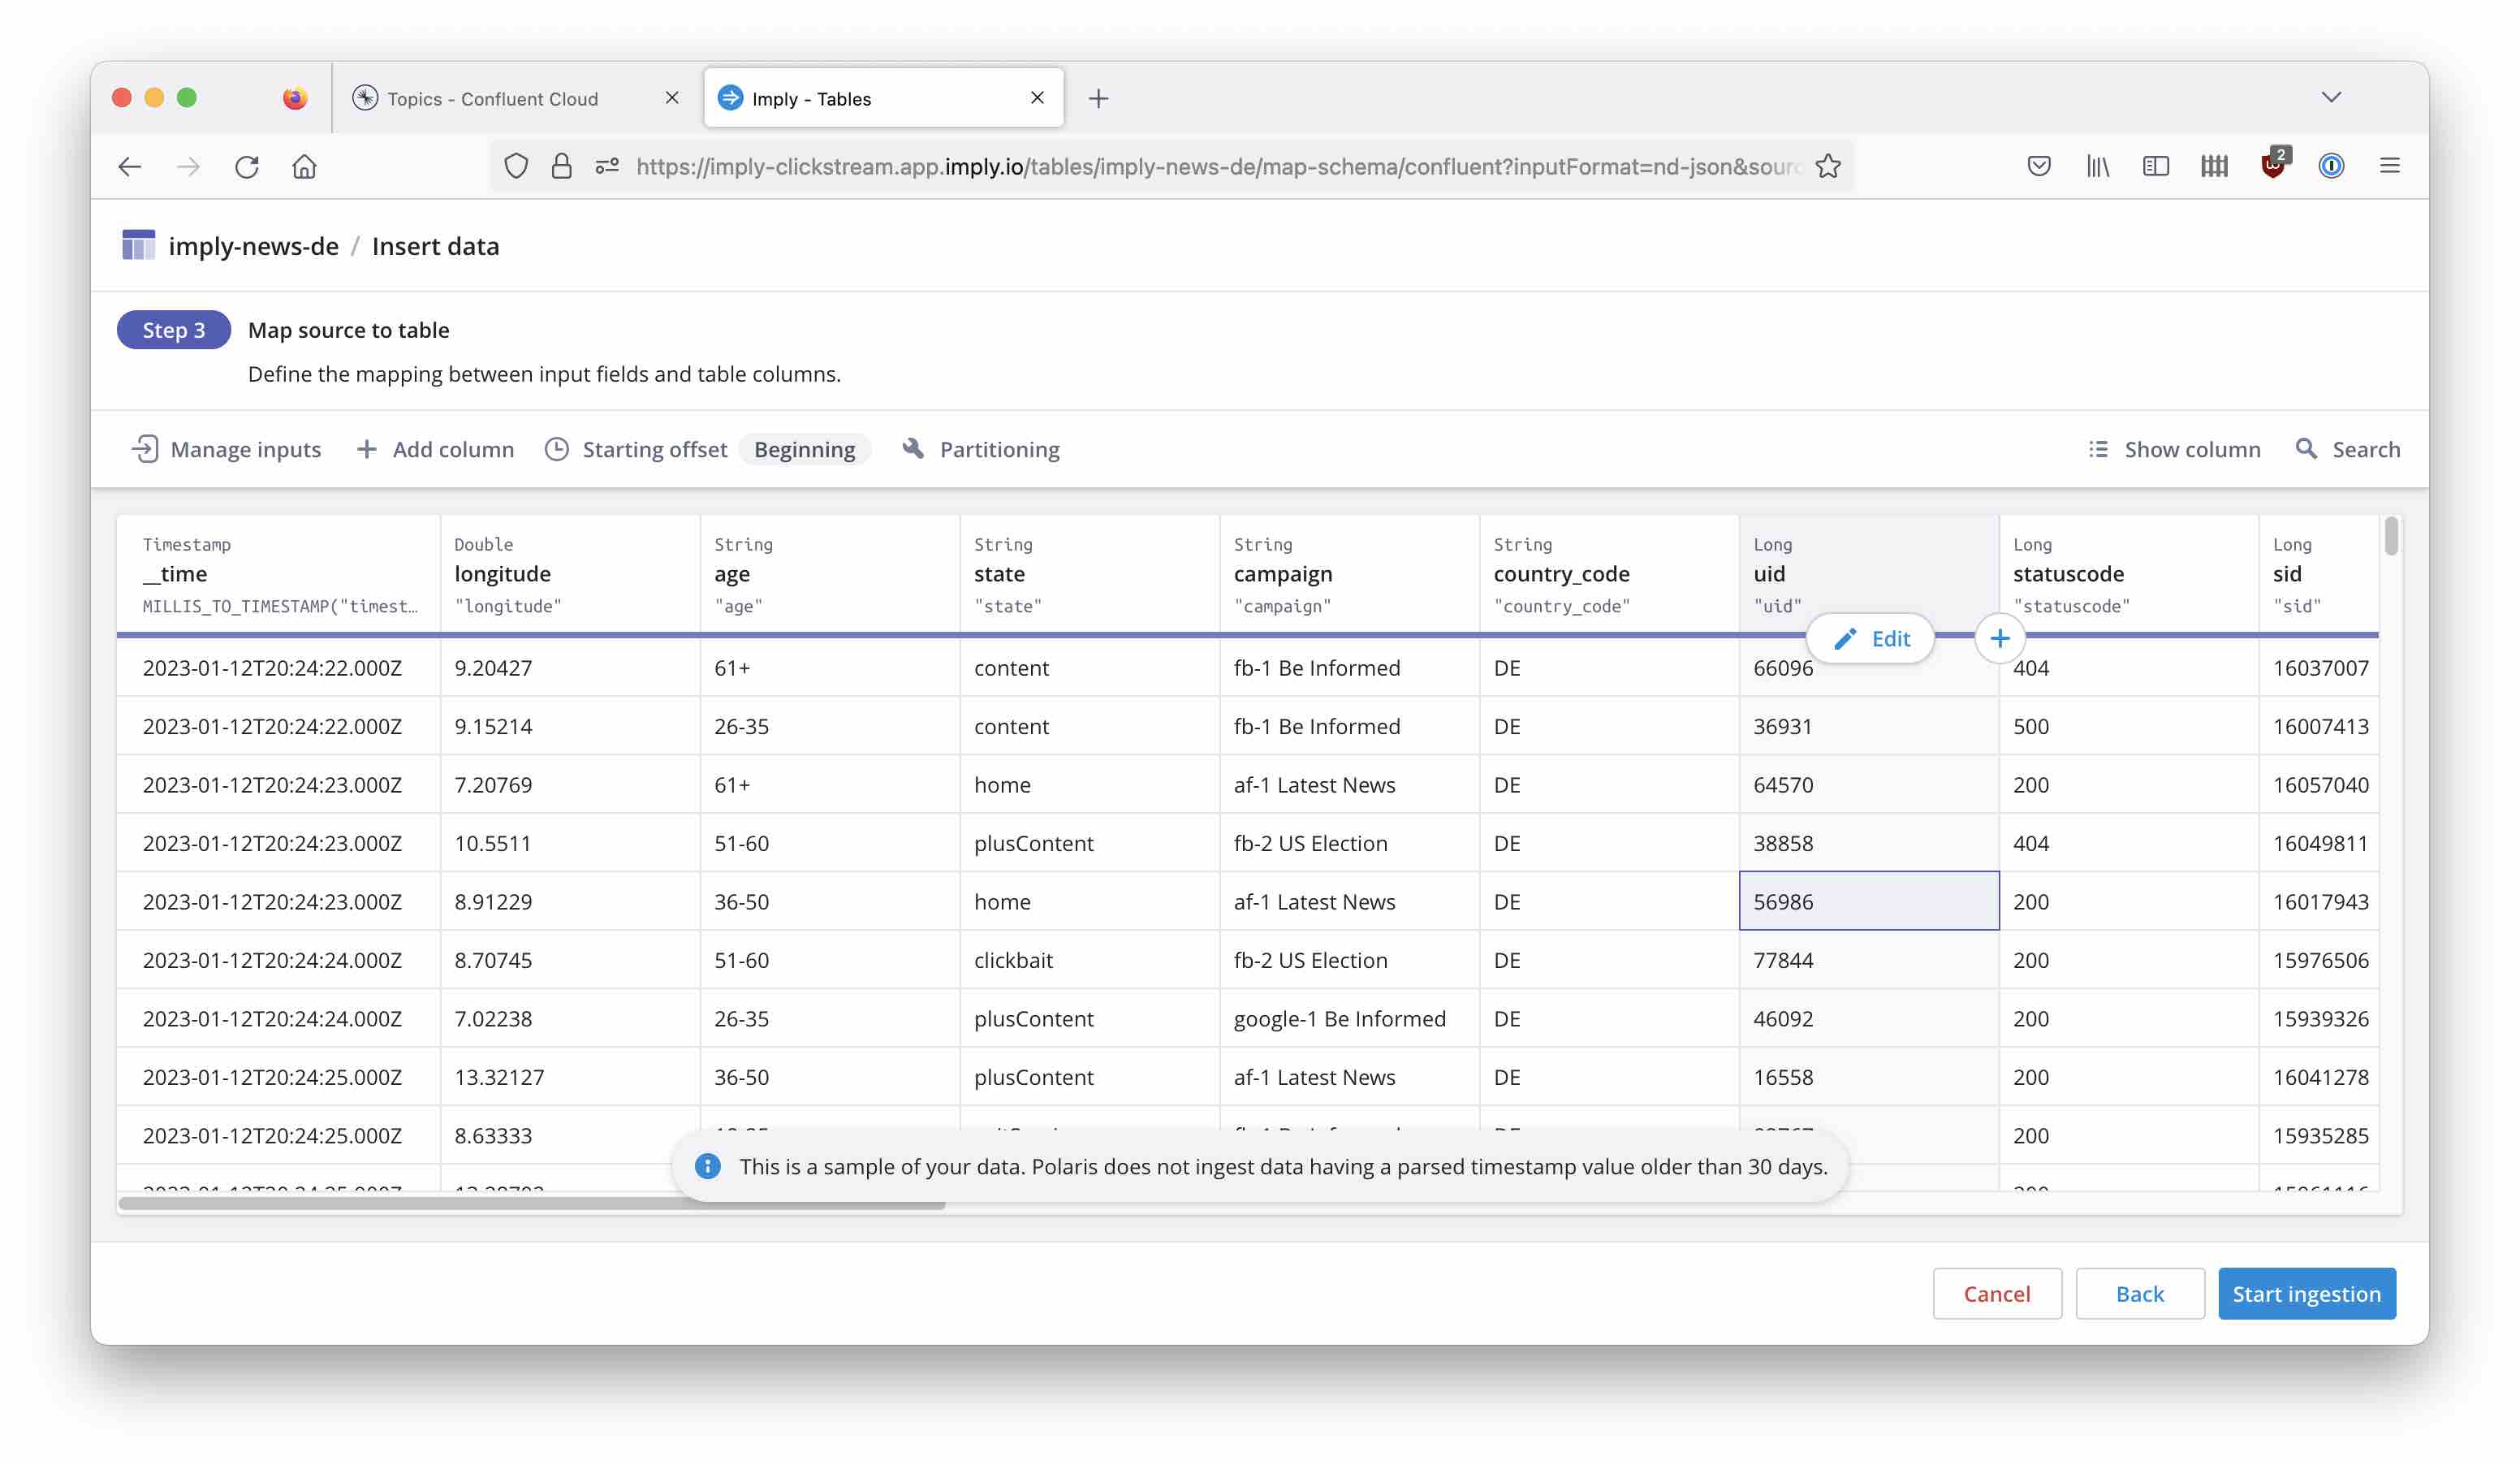
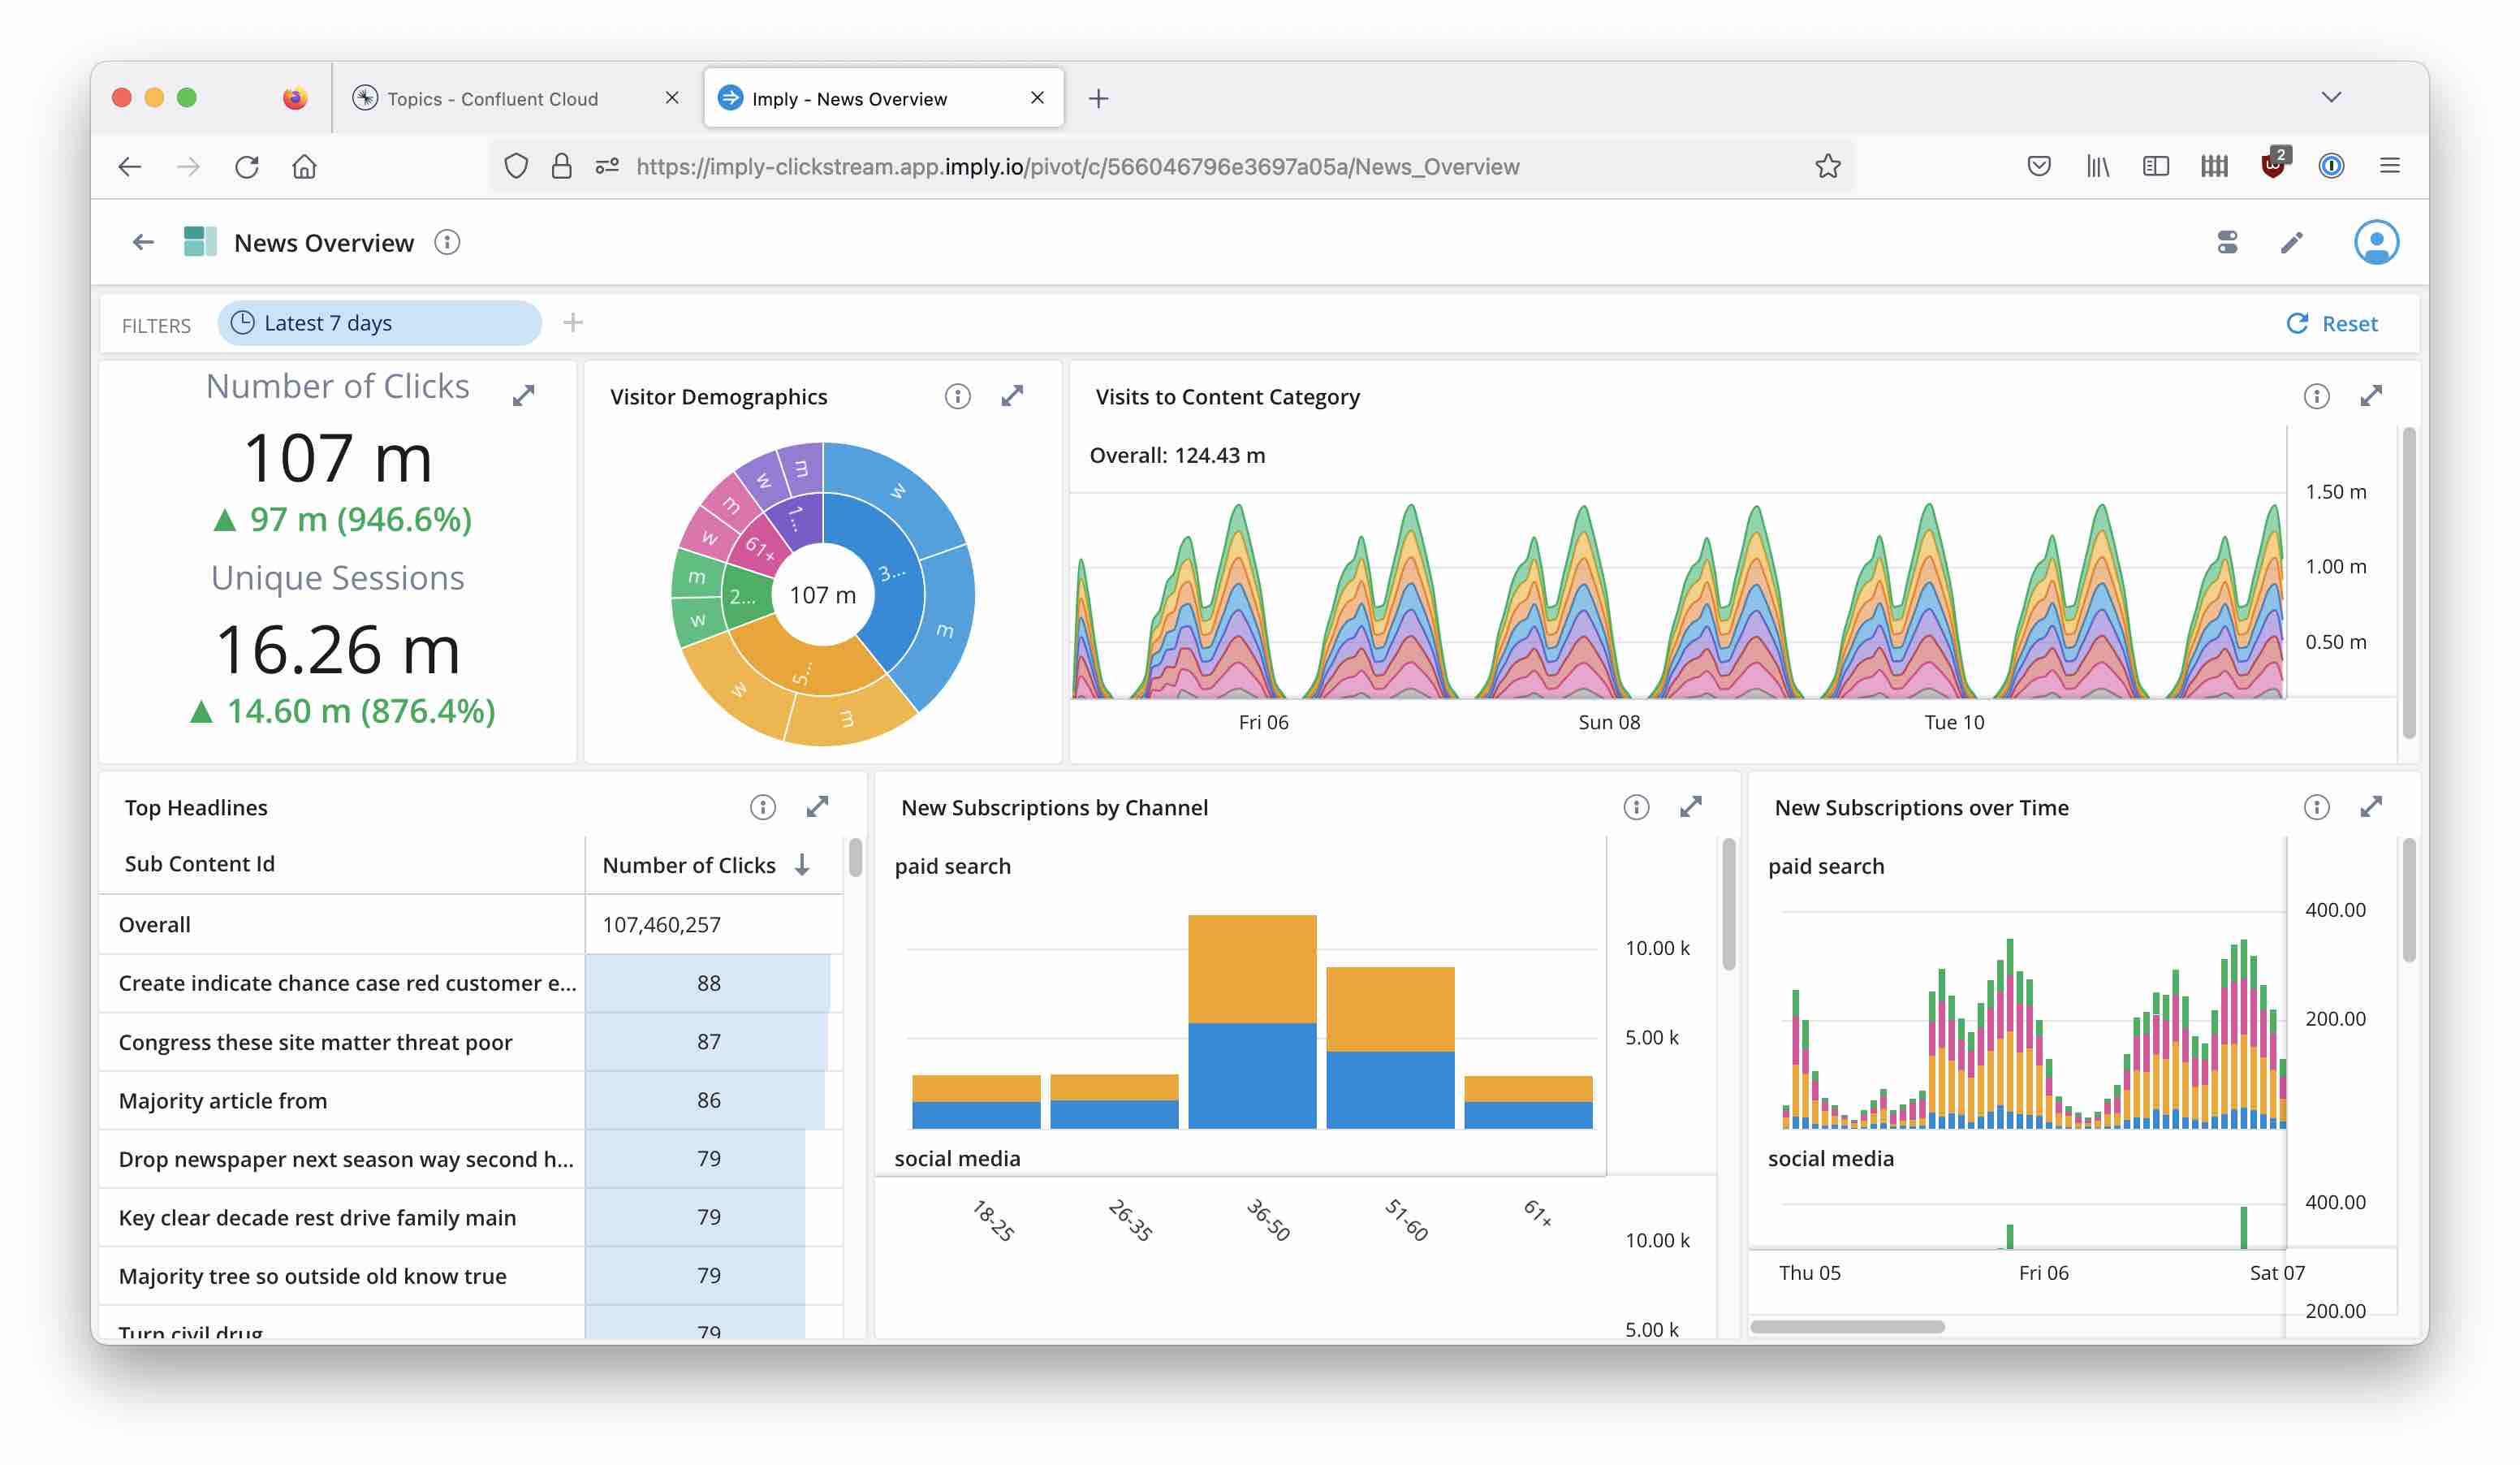
Start the ingestion job and watch the data coming in! Now you can continue with building dashboards like this:
Conclusion
What have we just learnt?
It is easy to build a streaming analytics architecture on top of Kafka and Druid. I haven’t had to write a line of code to put this together.
We have seen two flavors of SQL which complement each other in streaming analytics, although they work in very different ways:
ksqlDB enables streaming SQL for ETL and event processing:
- ksqlDB queries are mostly push queries - you continue to get new results. You can also view each query as an encapsulated streaming application.
- Each ksqlDB query generates a new stream. Also, each aggregation that you defined in ksqlDB creates a new stream.
Druid enables streaming analytics:
- Druid has a scalable and highly performant way to ingest streaming data.
- Druid contains a (typically) fine grained model of all your data.
- Druid queries can aggregate at any level and slice and dice every which way.
- Druid queries are pull queries and give a snapshot of the data store at the time it was queried.
Together, they form a powerful combo!
Image source: Lambda and Kappa architecture diagrams are linked from this Ericsson blog.
-
Not in the sense of hard real time like in embedded systems - here we speak of latencies in the range of seconds or fraction of a second. ↩