Druid Data Cookbook: Counting Unique Visitors for Overlapping Segments
The Problem of Getting Unique Counts
A common problem in clickstream analytics is counting unique things, like visitors or sessions. Generally this involves scanning through all detail data, because unique counts do not add up as you aggregate the numbers.
For instance, we might be interested in the number of visitors that watched episodes of a TV show. Let’s say we found that at a given day, 1000 (unique) visitors watched episode 1 and 800 visitors watched episode 2. But we might have more questions, such as:
- How many visitors watched both episodes?
- How many visitors are there that watched at least one of the episodes?
- How many visitors watched episode 1 but not episode 2?
The answer is: there is no way to tell by just looking at the aggregated numbers. We will have to go back to the detail data and scan every single row. If the data volume is high enough, this may take long, meaning that an interactive data exploration is not possible.
An additional nuisance is that unique counts don’t work well with rollups. For the example above, it would be great if we could have just one row of data per 15 minute interval1, show, and episode. After all, we are not interested in the individual user IDs, just the unique counts.
Is there a way to avoid crunching the detail data every single time, and maybe even enable rollup?
Fast Approximation with Set Operations: Theta Sketches
Theta Sketches are a probabilistic data structure to enable fast approximate analysis of big data. Druid’s implementation relies on the Apache DataSketches library, and you can find a detailed explanation of how they work in the docs there.
Theta Sketches have a few nice properties:
- They give you a fast approximate estimate for the distinct count of items that you put into them.
- They are mergeable. This means we can work with rolled-up data and merge the sketches over various time intervals. Thus, we can take advantage of Druid’s rollup feature.
- What’s even more, theta sketches support set operations. Given two theta sketches over subsets of the data, we can compute the union, intersection, or set difference of these two. This gives us the ability to answer the questions above about the number of visitors that watched a specific combination of episodes.
There is a lot of advanced math behind theta sketches2. But with Druid, you do not need to bother about the complex algorithms - theta sketches just work!
Building a Data Model with Theta Sketches
As usual, let’s work with the Druid quickstart. For demonstration purposes, let’s ingest the snippet below which has just the bare basics that are needed:
- a timestamp, in this case it’s just dates but as mentioned above a finer granularity makes sense in real life;
- a user ID;
- show and episode identifiers.
date,uid,show,episode
2022-05-19,alice,Game of Thrones,S1E1
2022-05-19,alice,Game of Thrones,S1E2
2022-05-19,alice,Game of Thrones,S1E1
2022-05-19,bob,Bridgerton,S1E1
2022-05-20,alice,Game of Thrones,S1E1
2022-05-20,carol,Bridgerton,S1E2
2022-05-20,dan,Bridgerton,S1E1
2022-05-21,alice,Game of Thrones,S1E1
2022-05-21,carol,Bridgerton,S1E1
2022-05-21,erin,Game of Thrones,S1E1
2022-05-21,alice,Bridgerton,S1E1
2022-05-22,bob,Game of Thrones,S1E1
2022-05-22,bob,Bridgerton,S1E1
2022-05-22,carol,Bridgerton,S1E2
2022-05-22,bob,Bridgerton,S1E1
2022-05-22,erin,Game of Thrones,S1E1
2022-05-22,erin,Bridgerton,S1E2
2022-05-23,erin,Game of Thrones,S1E1
2022-05-23,alice,Game of Thrones,S1E1
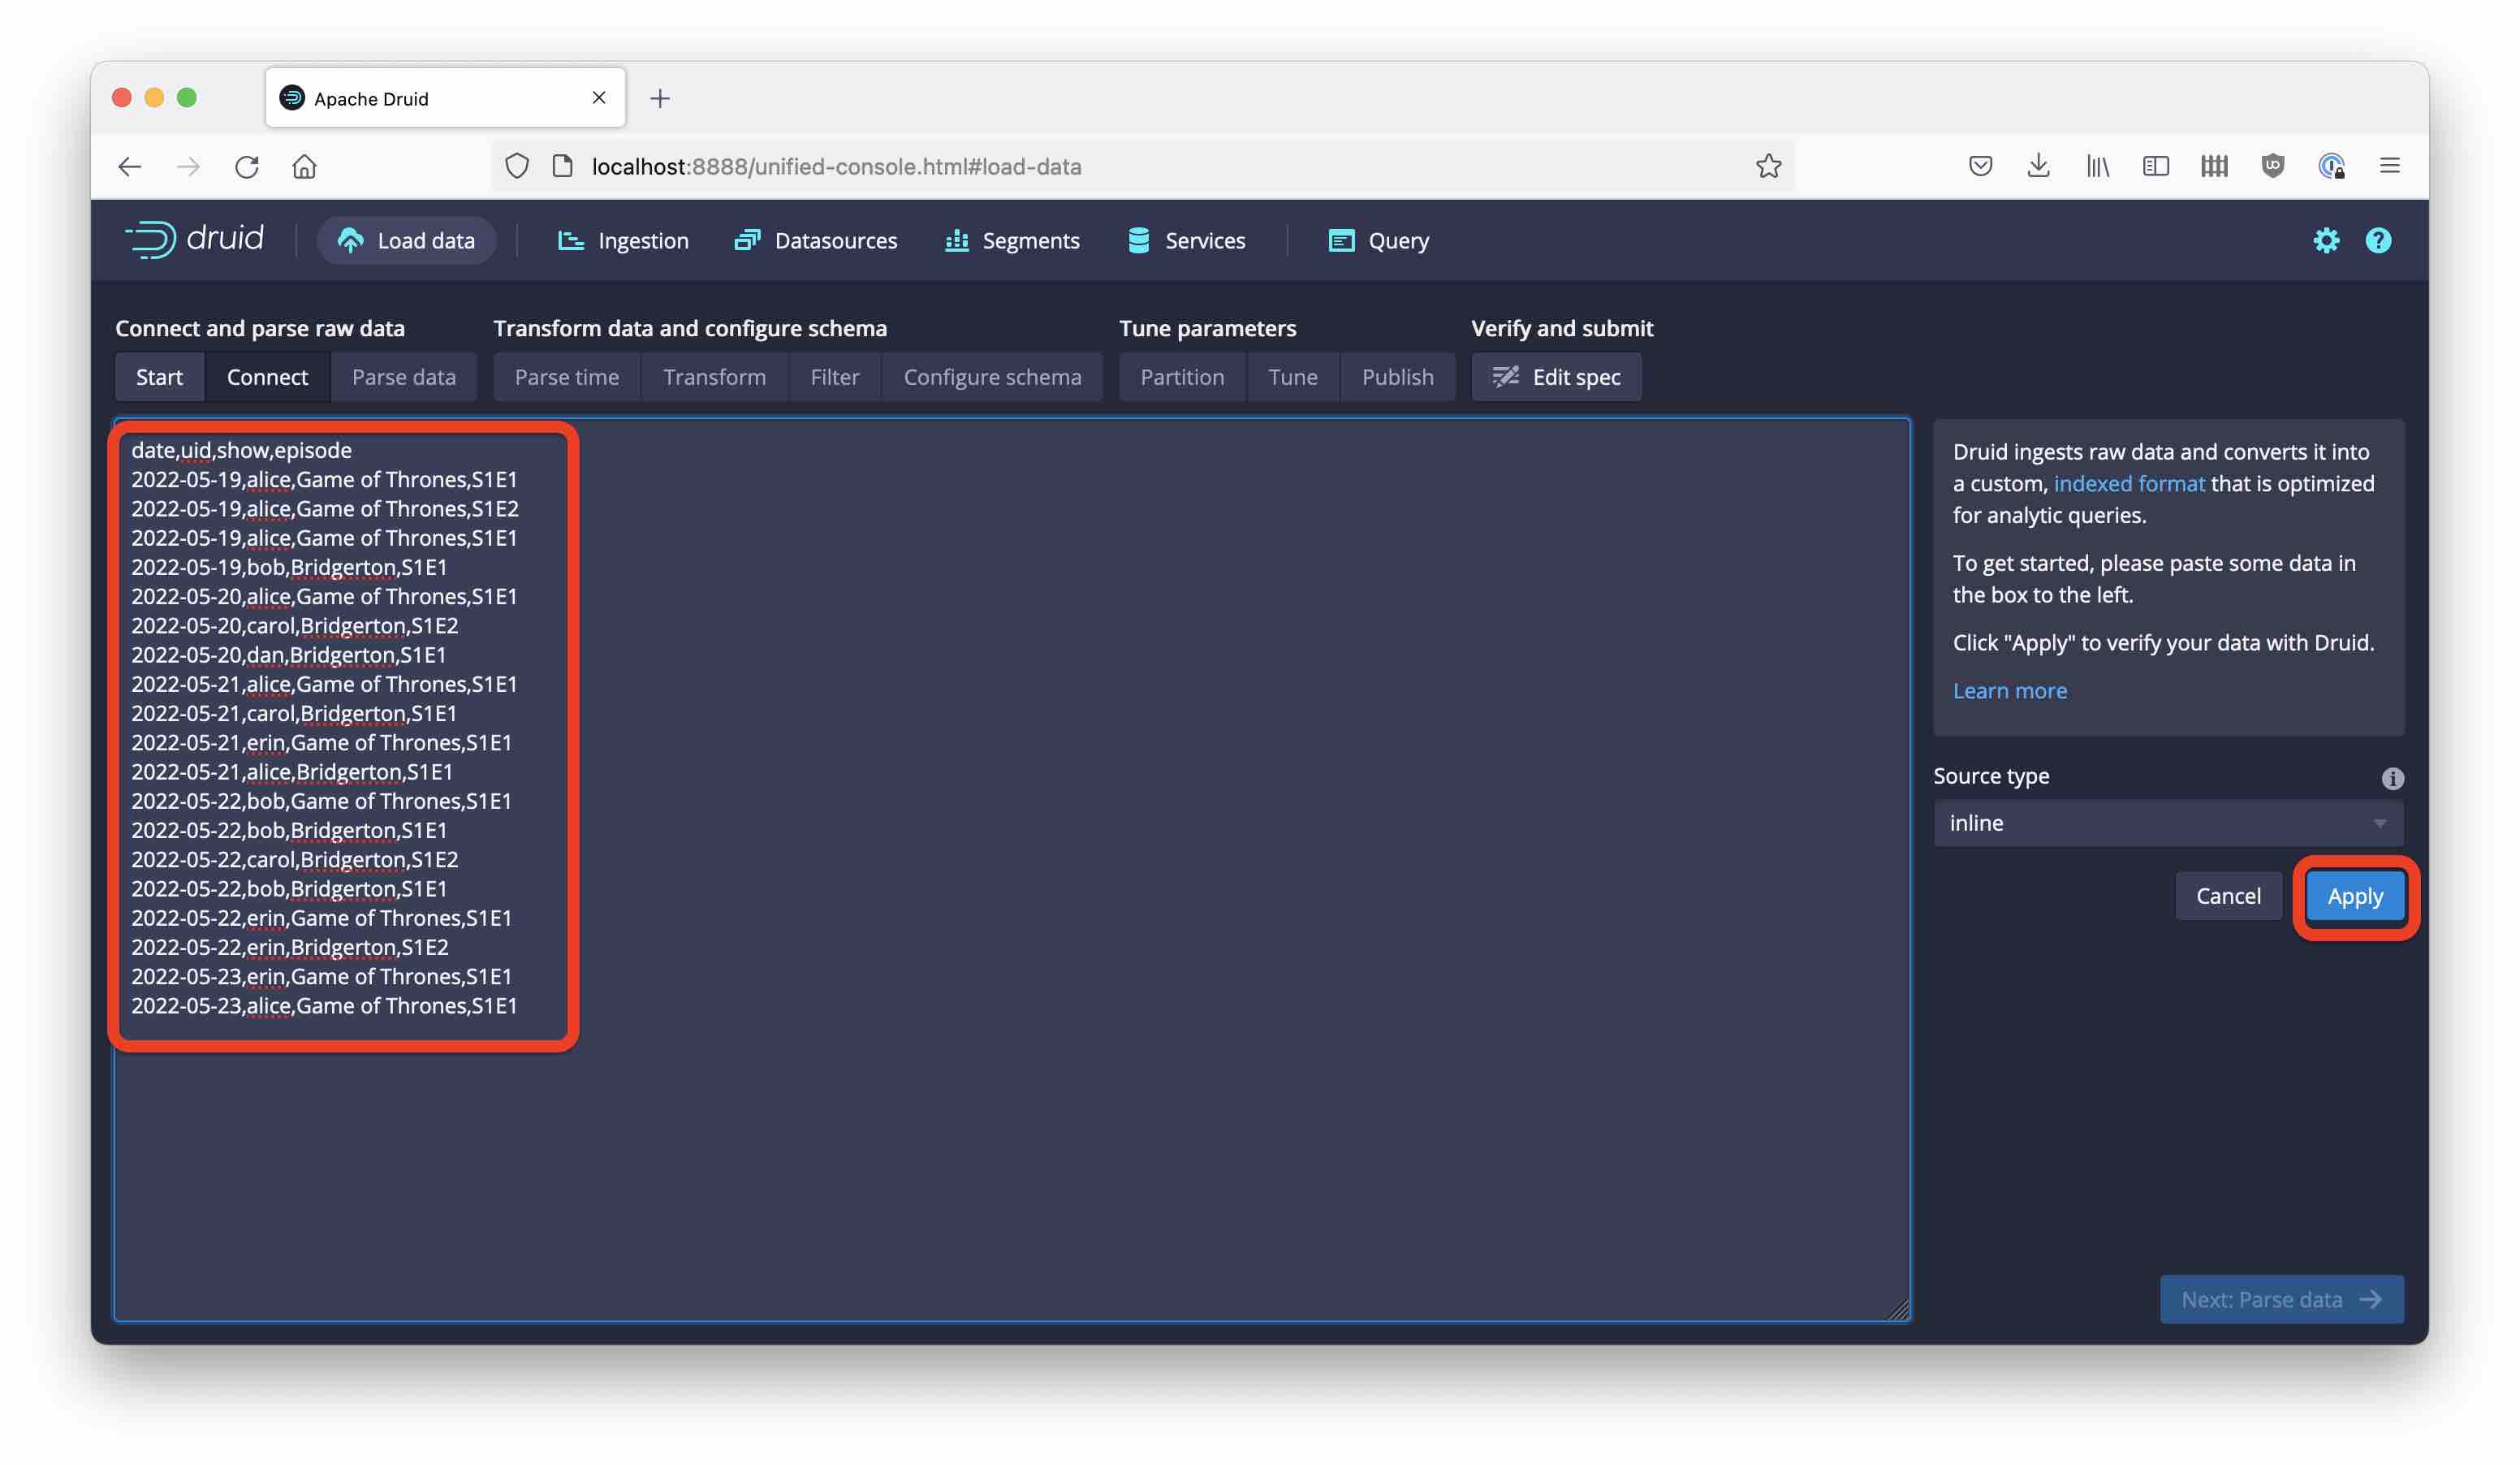
Open the Druid console at localhost:8888 and go to the Load data wizard. Select Paste data as the data source and paste the sample from above:
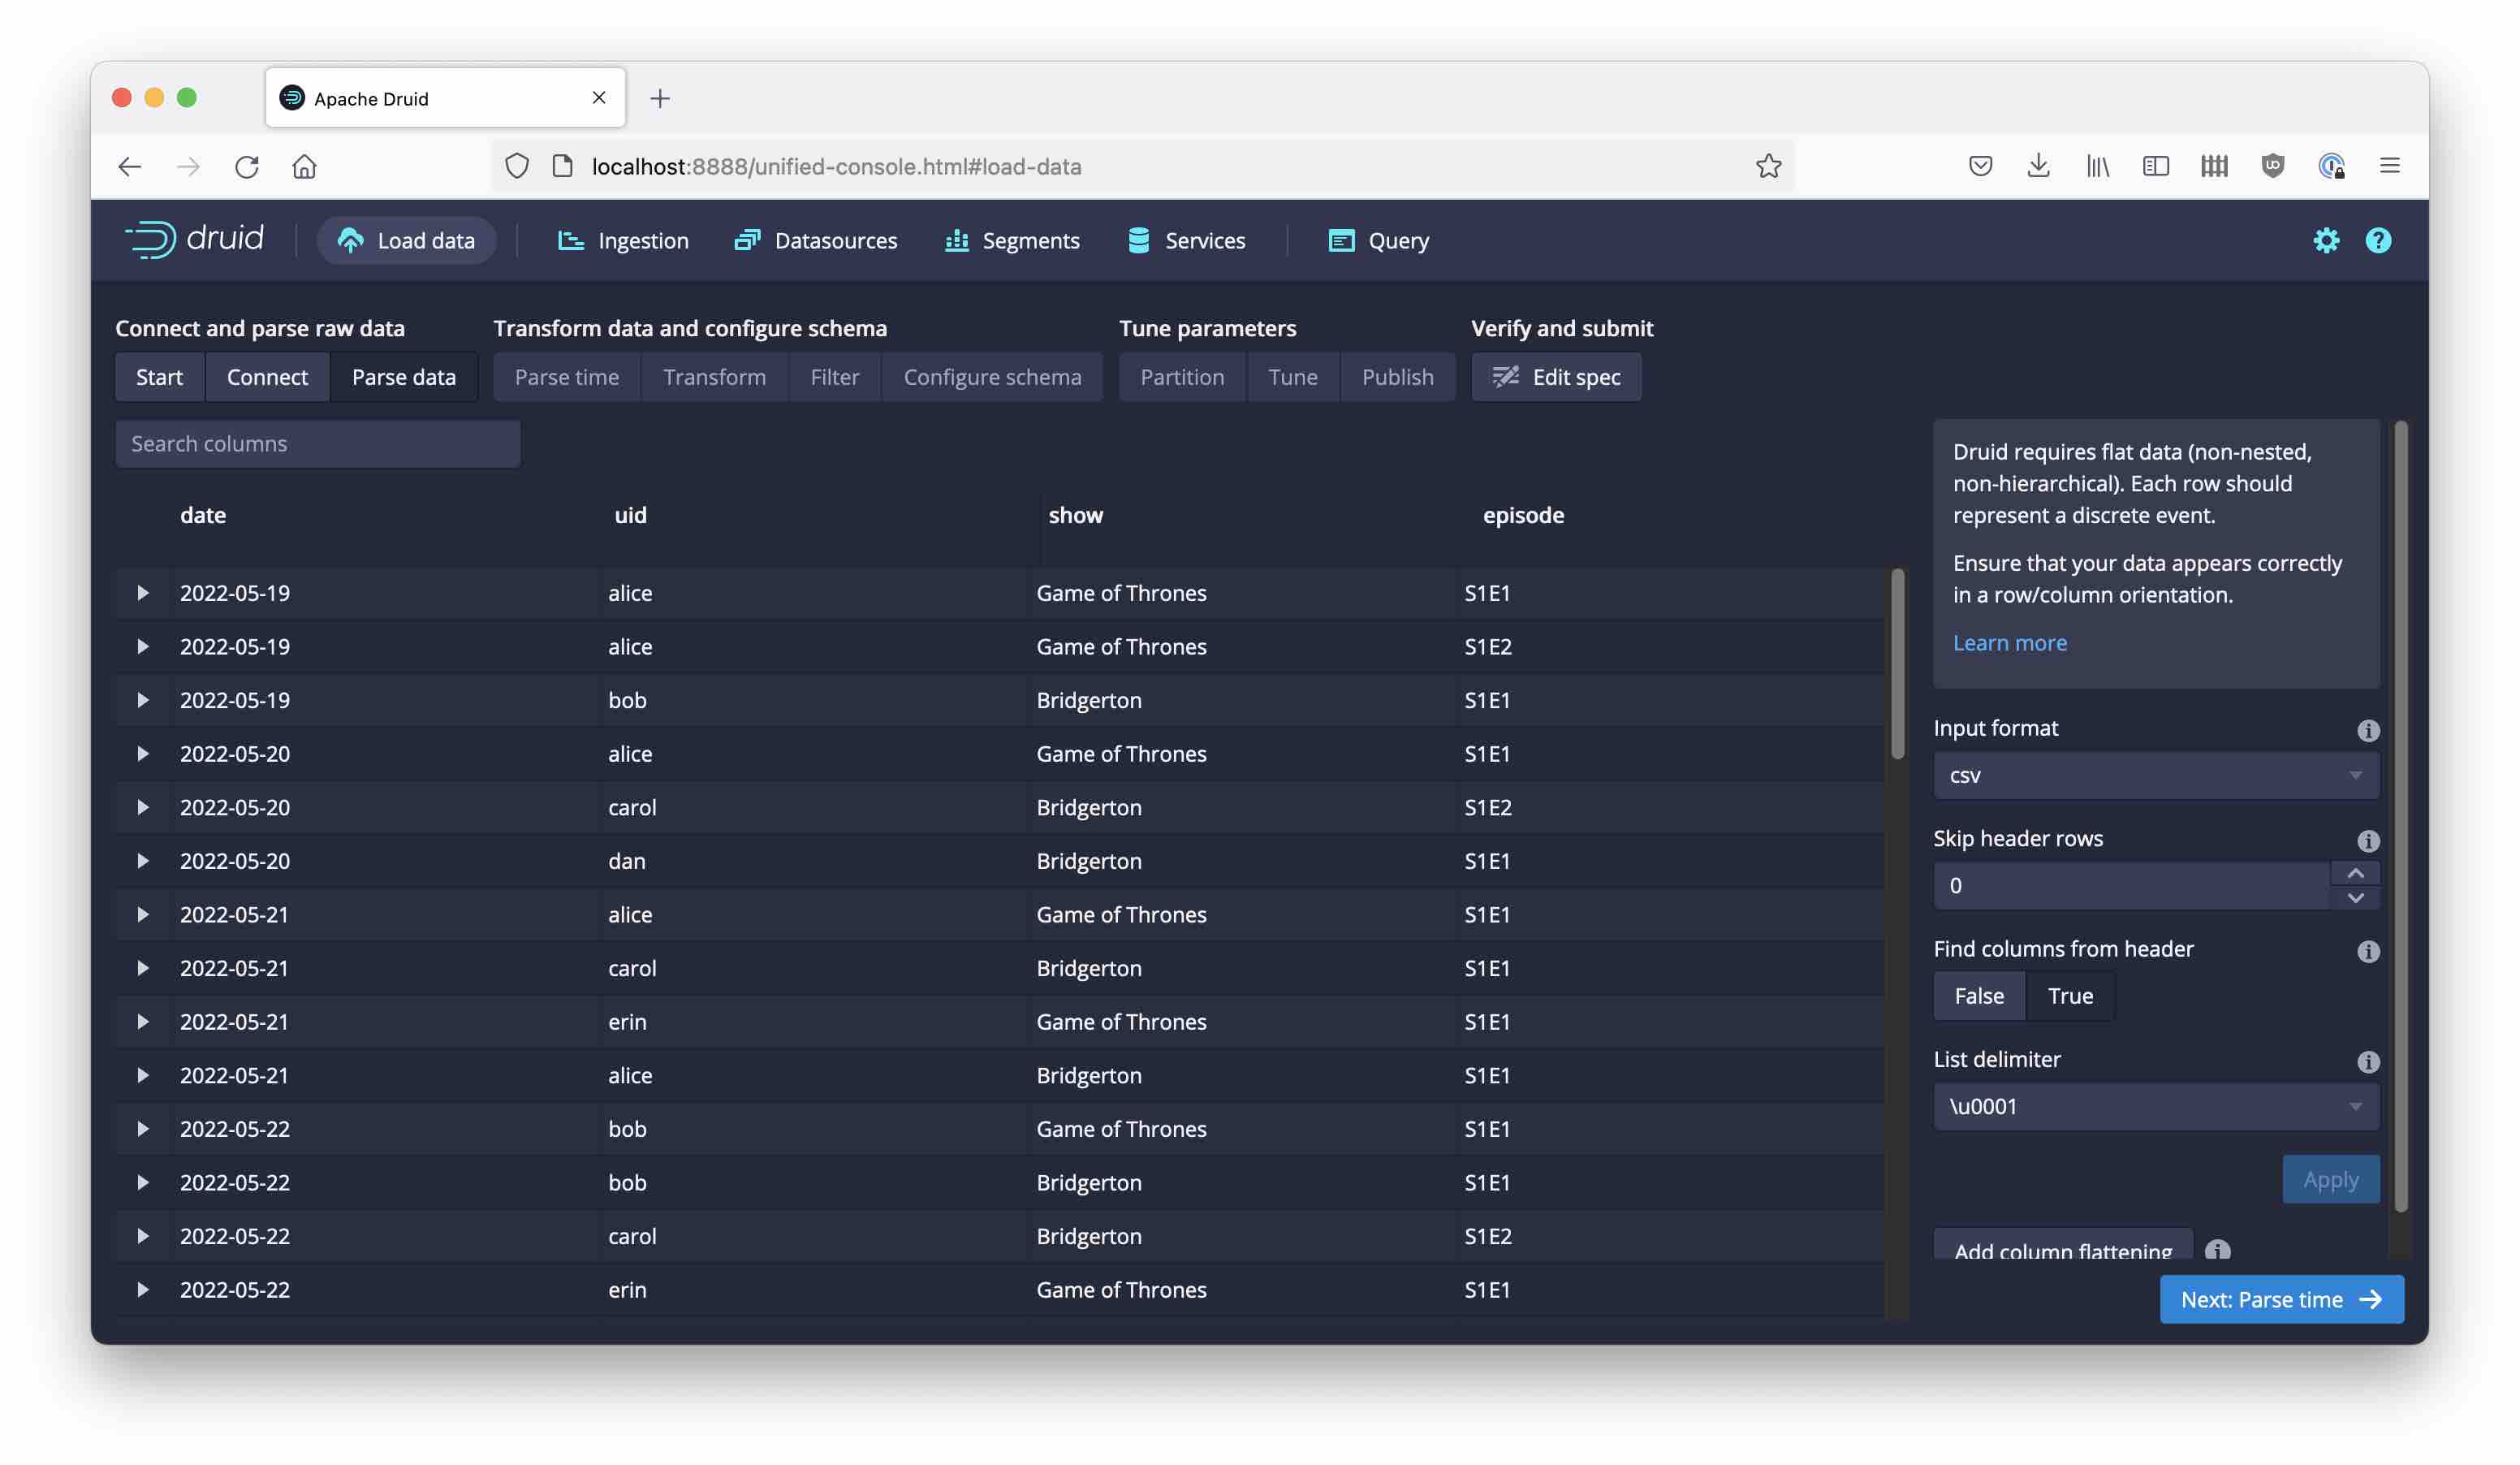
Parse the data as CSV, with included headers:
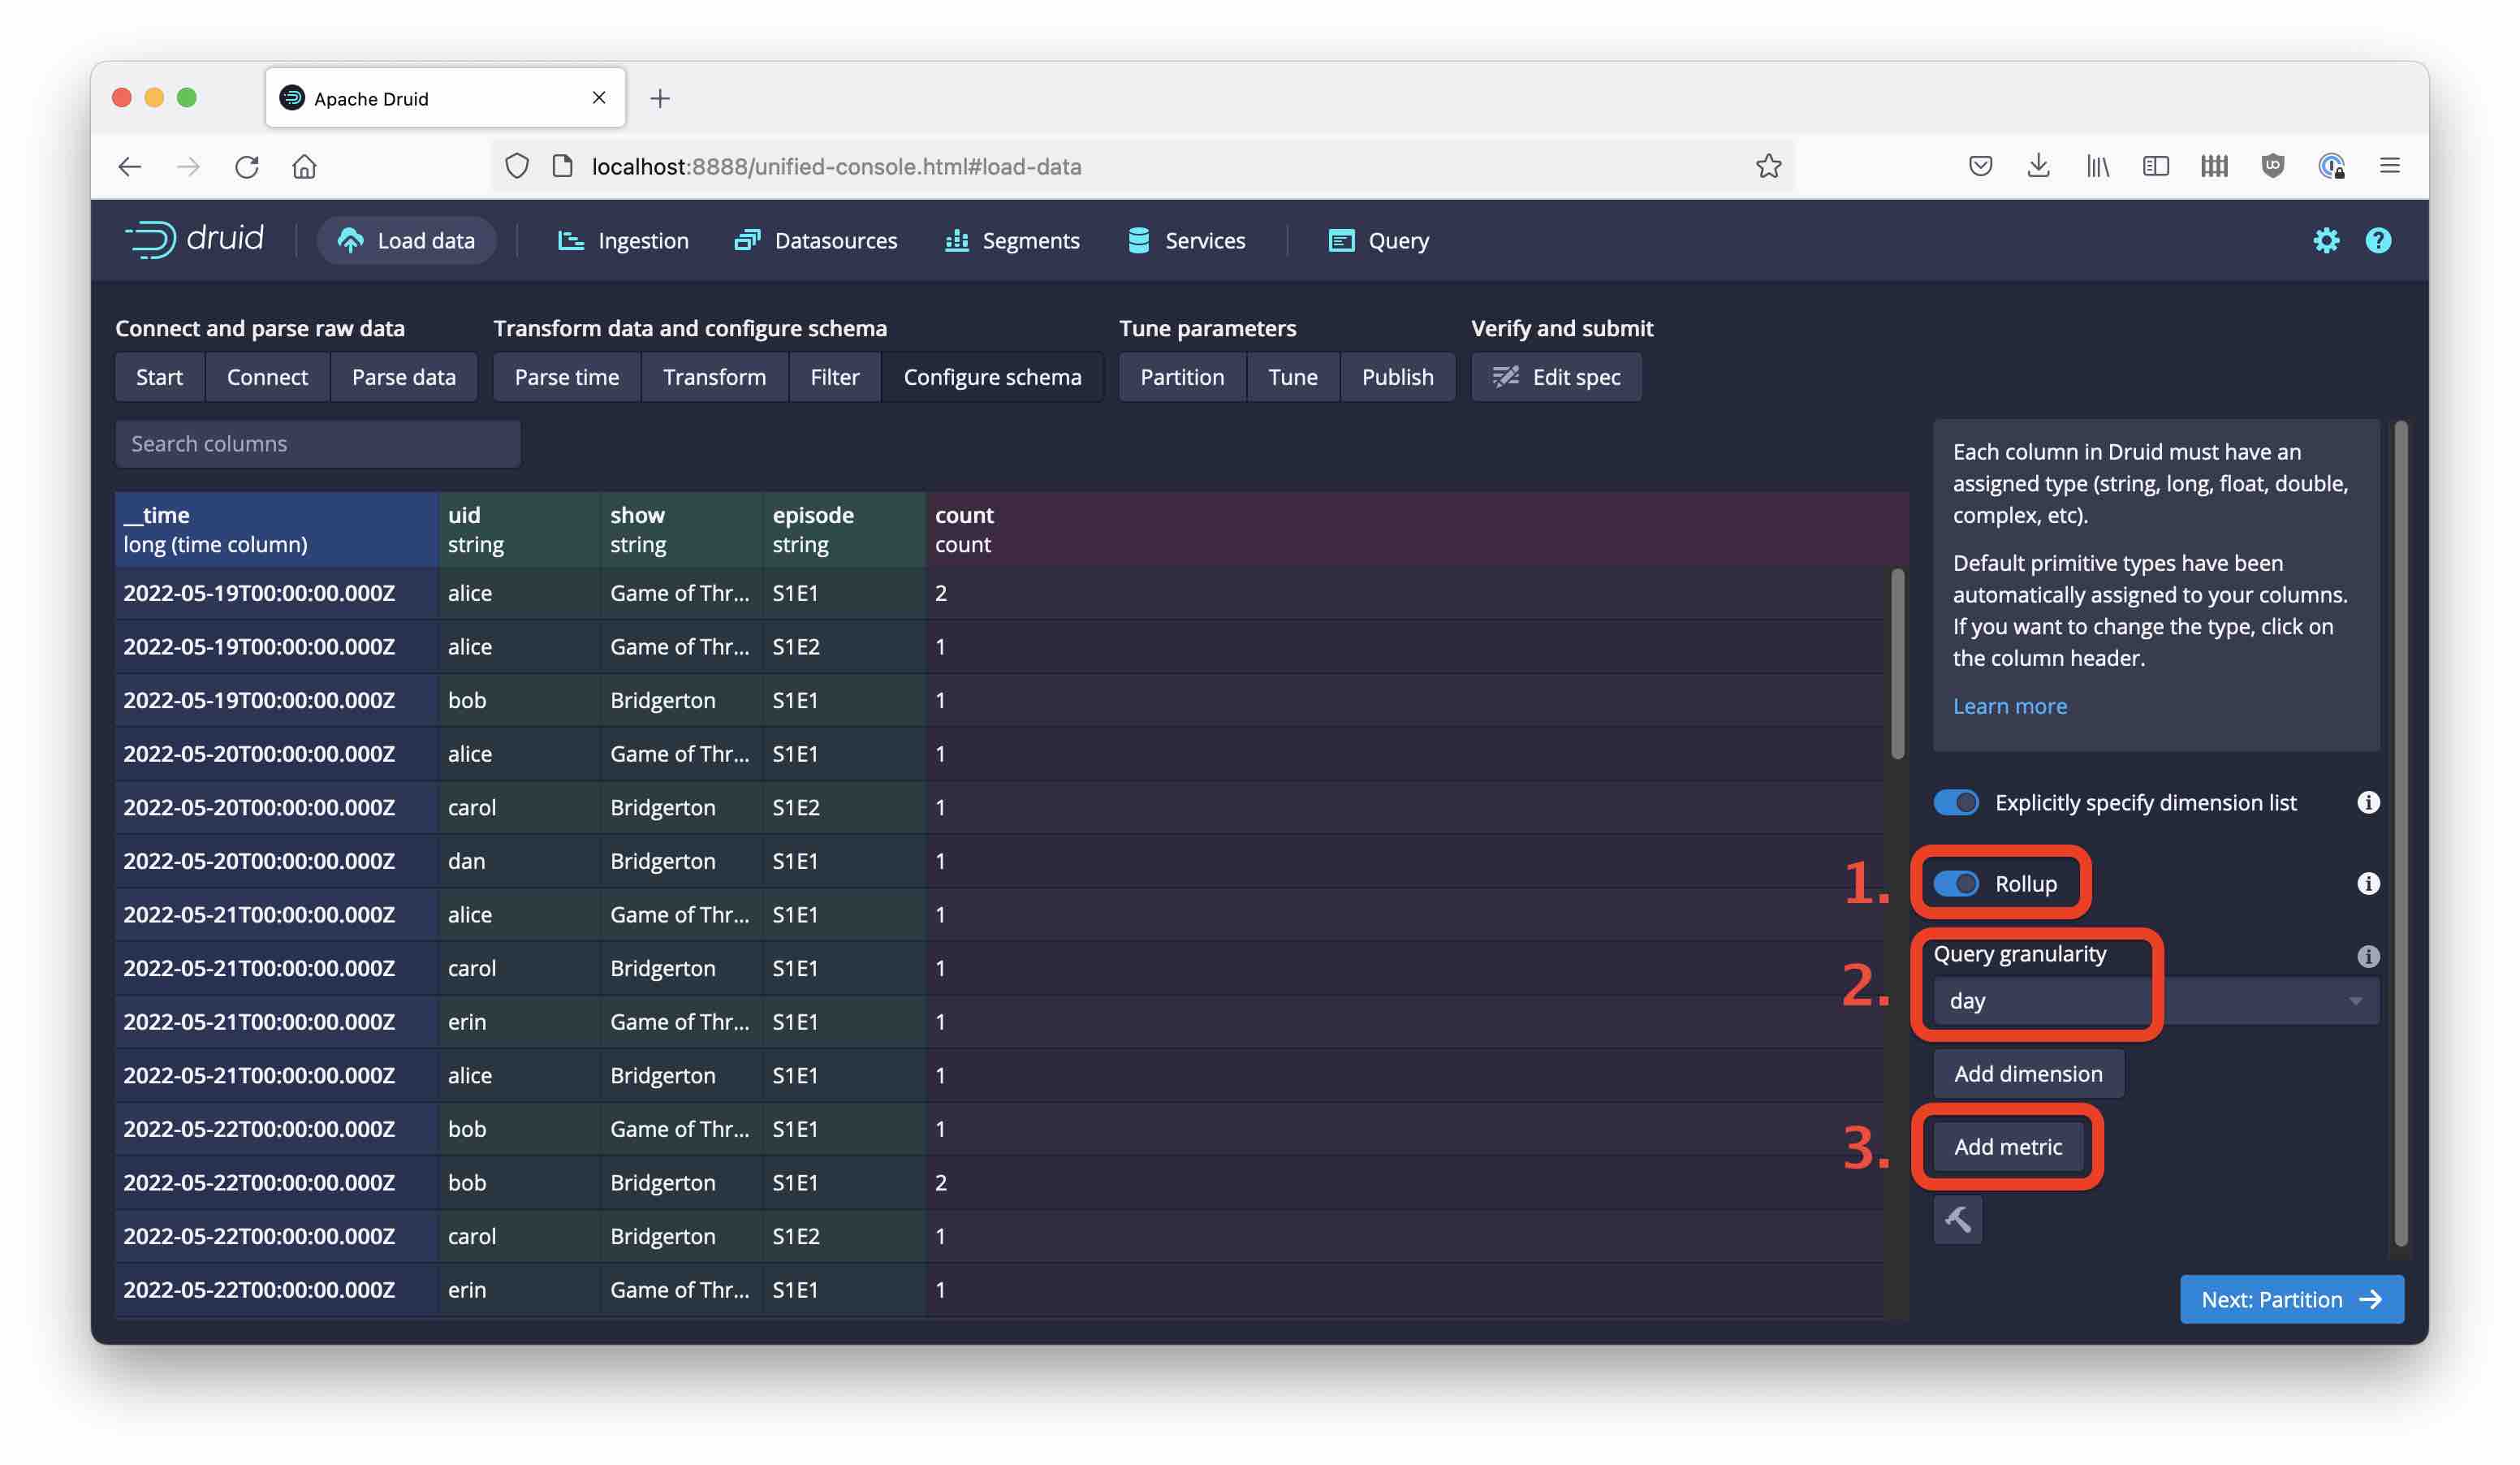
Accept the defaults for Parse time, Transform, and Filter. In the Configure schema stage, enable Rollup and confirm your choice in the popup. Then set the query granularity to day.
This is where we will add the theta sketch. It should be a metric, so select the Add metric button:
Define the new metric as a theta sketch over the uid field, leaving the default settings in place:
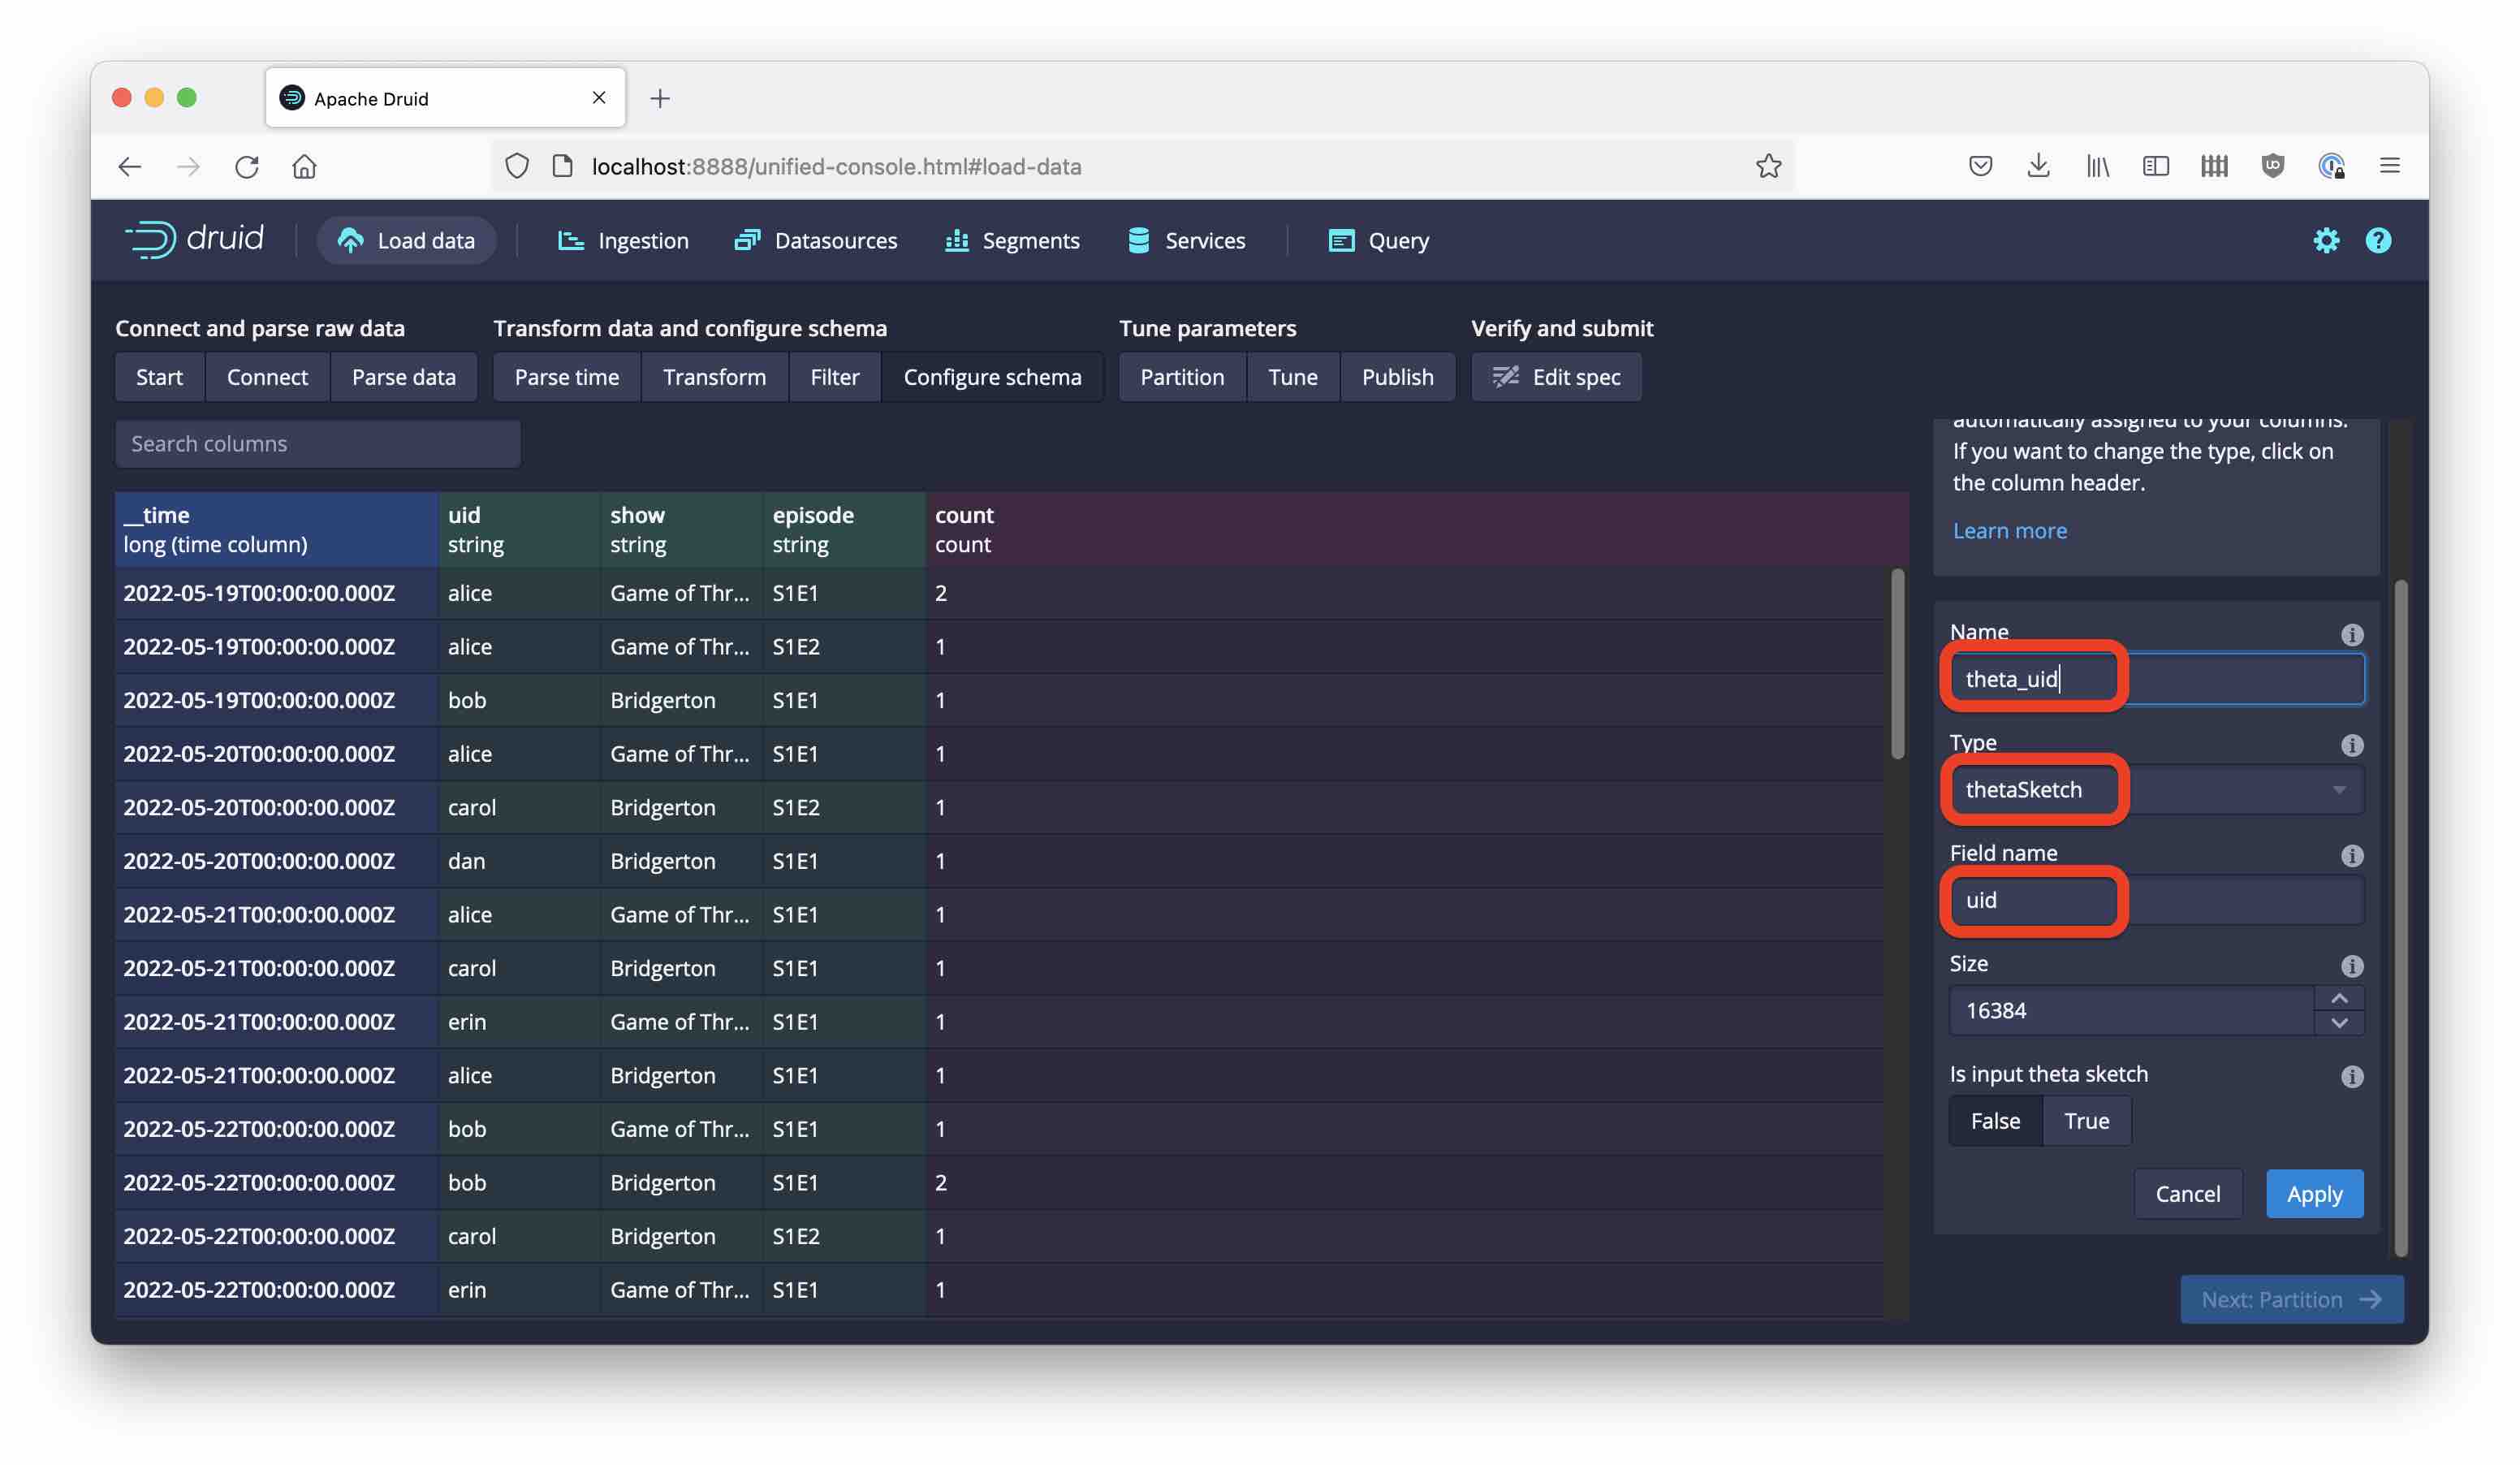
Hit Apply to add the new metric to the data model.
We have to perform one more step to complete the data model. I said above that we are not interested in the individual user id’s, only the unique counts. Right now, uid is still in the data model. Let’s get rid of that!
Click on the uid column in the data model and delete it using the trashcan button on the right:
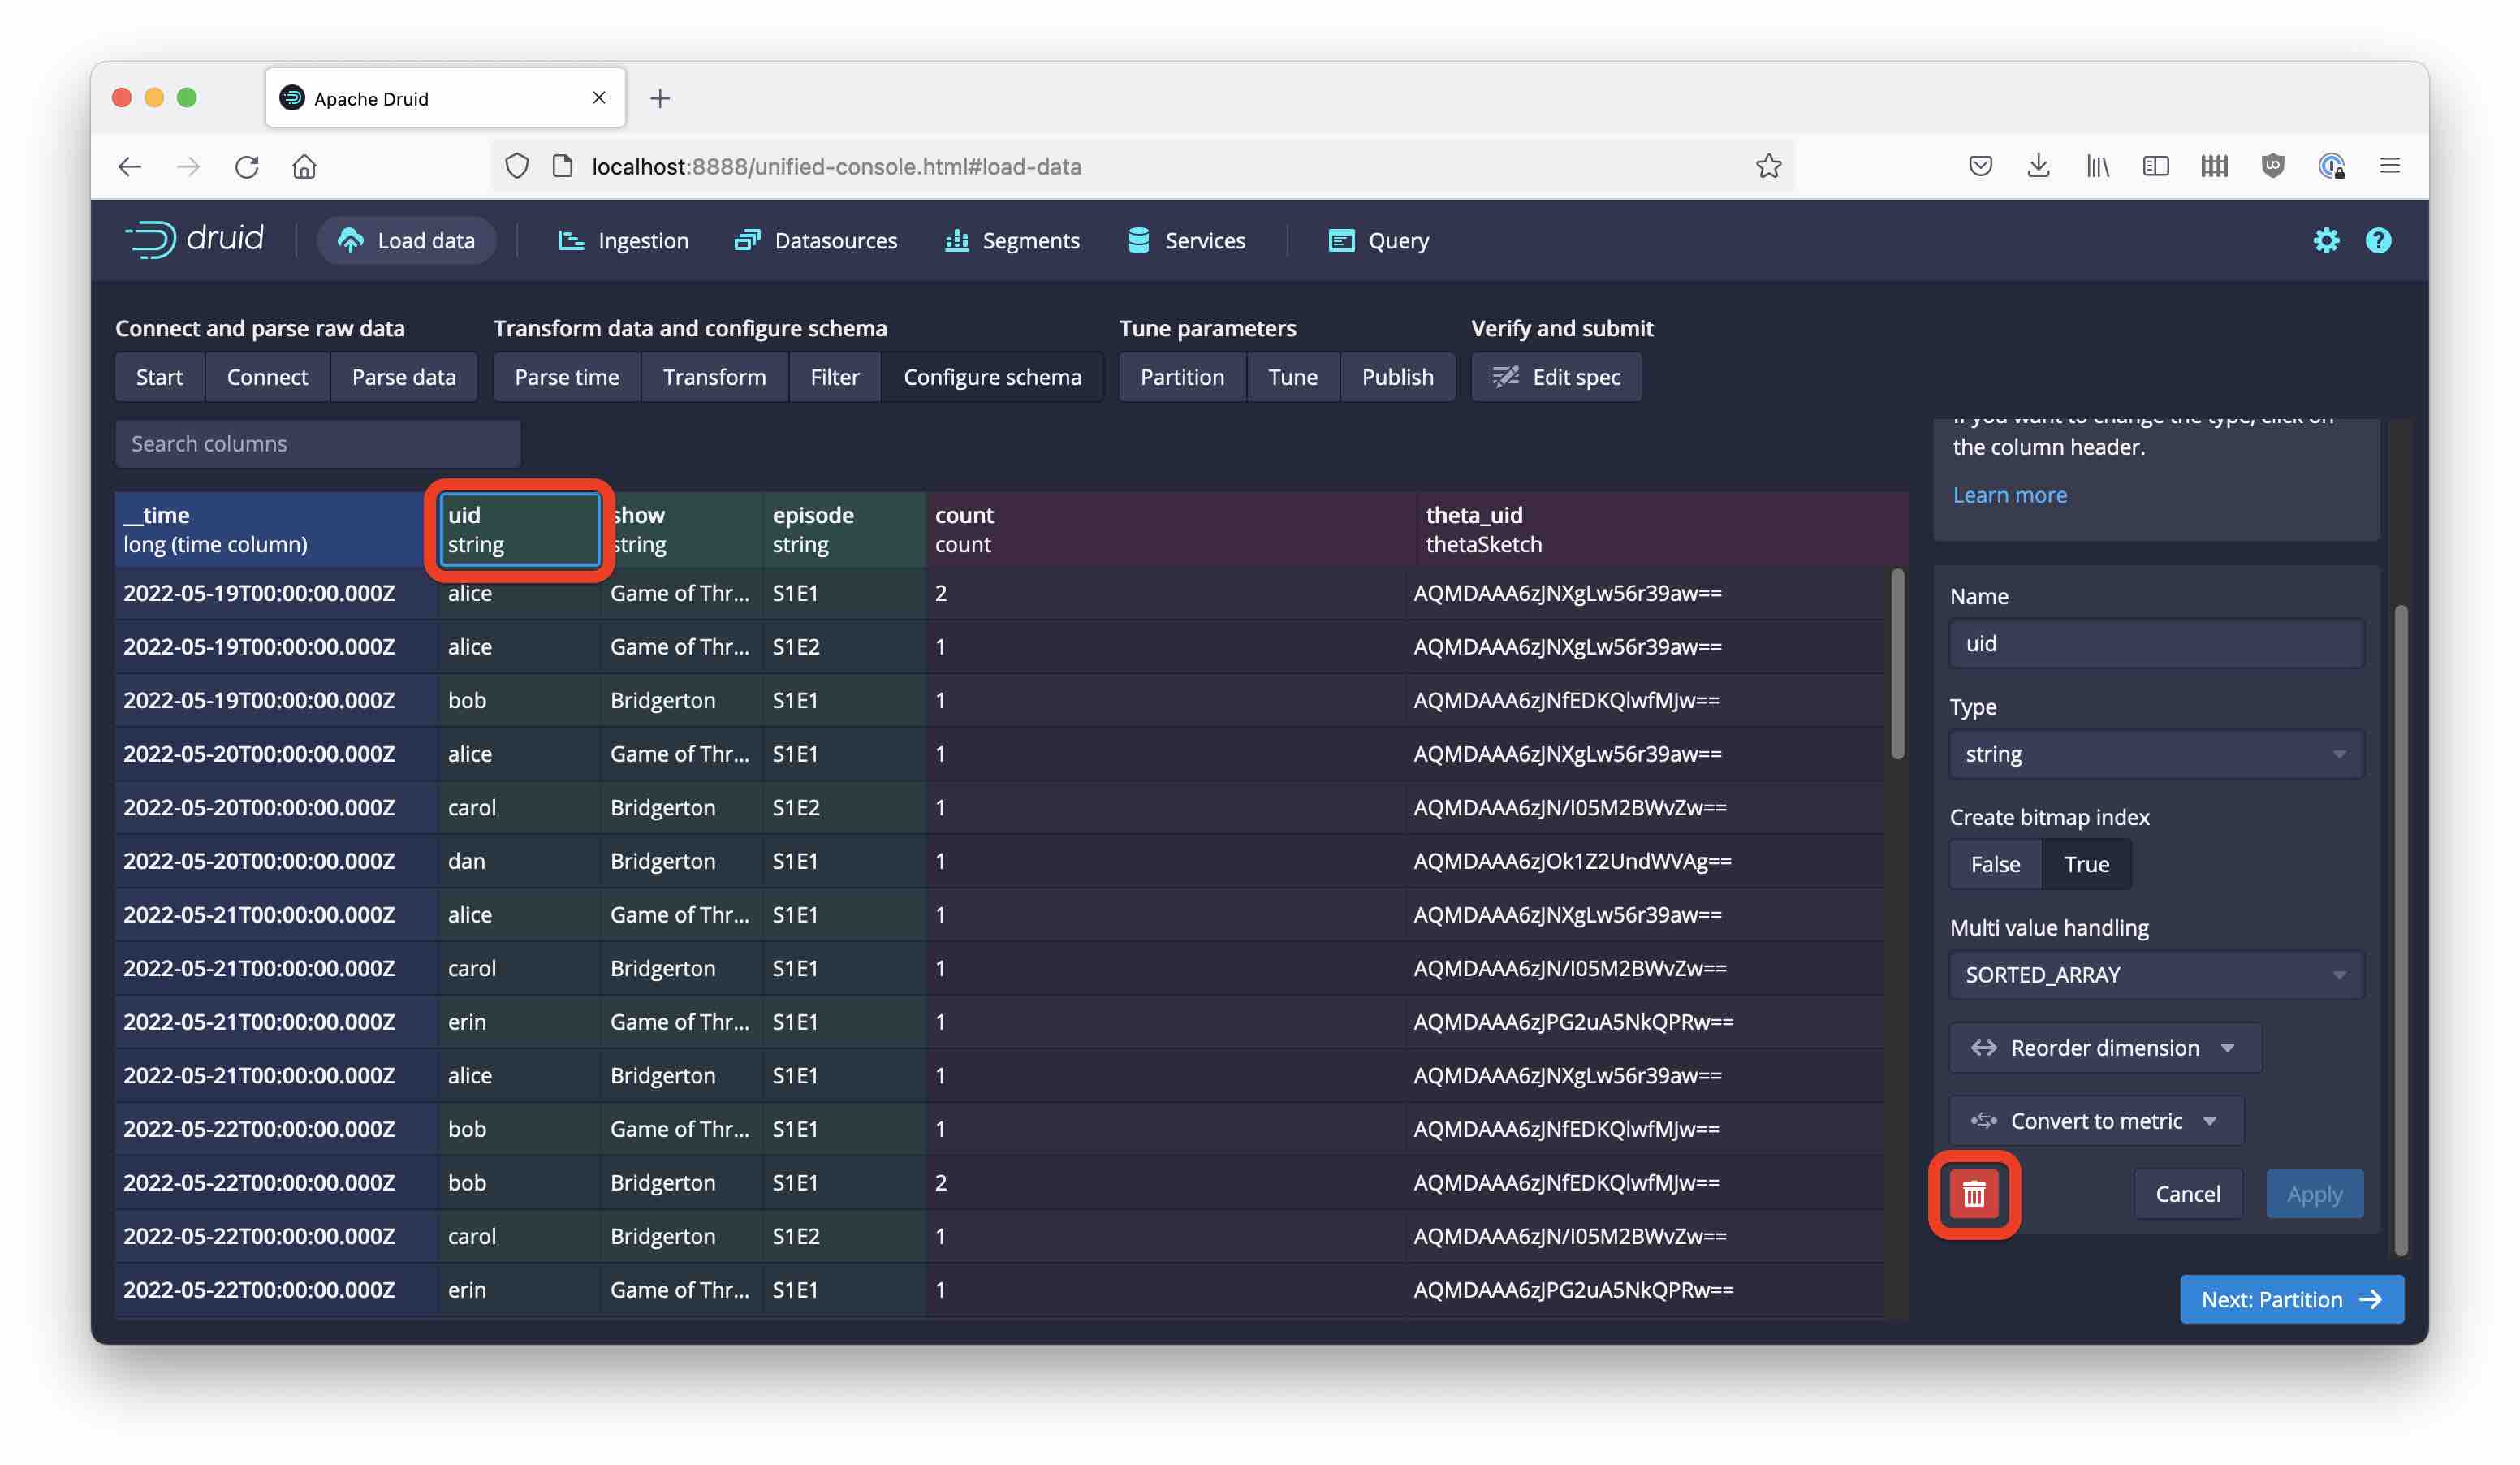
That’s it! In the following screens, set the segment granularity to DAY, pick a name for your new table, and start the ingestion.
Querying the Theta Sketch Column
Much as with the quantile sketches, getting a unique count estimate out of a theta sketch column involves two steps:
- merging the sketch columns by means of an aggregator function, which in Druid SQL is called
DS_THETA - getting the estimate out of the merged sketch using
THETA_SKETCH_ESTIMATE.
Between step 1 and 2, you can apply set functions. We will come to that in a moment.
Basic Counting
Let’s first see what the data looks like in Druid:
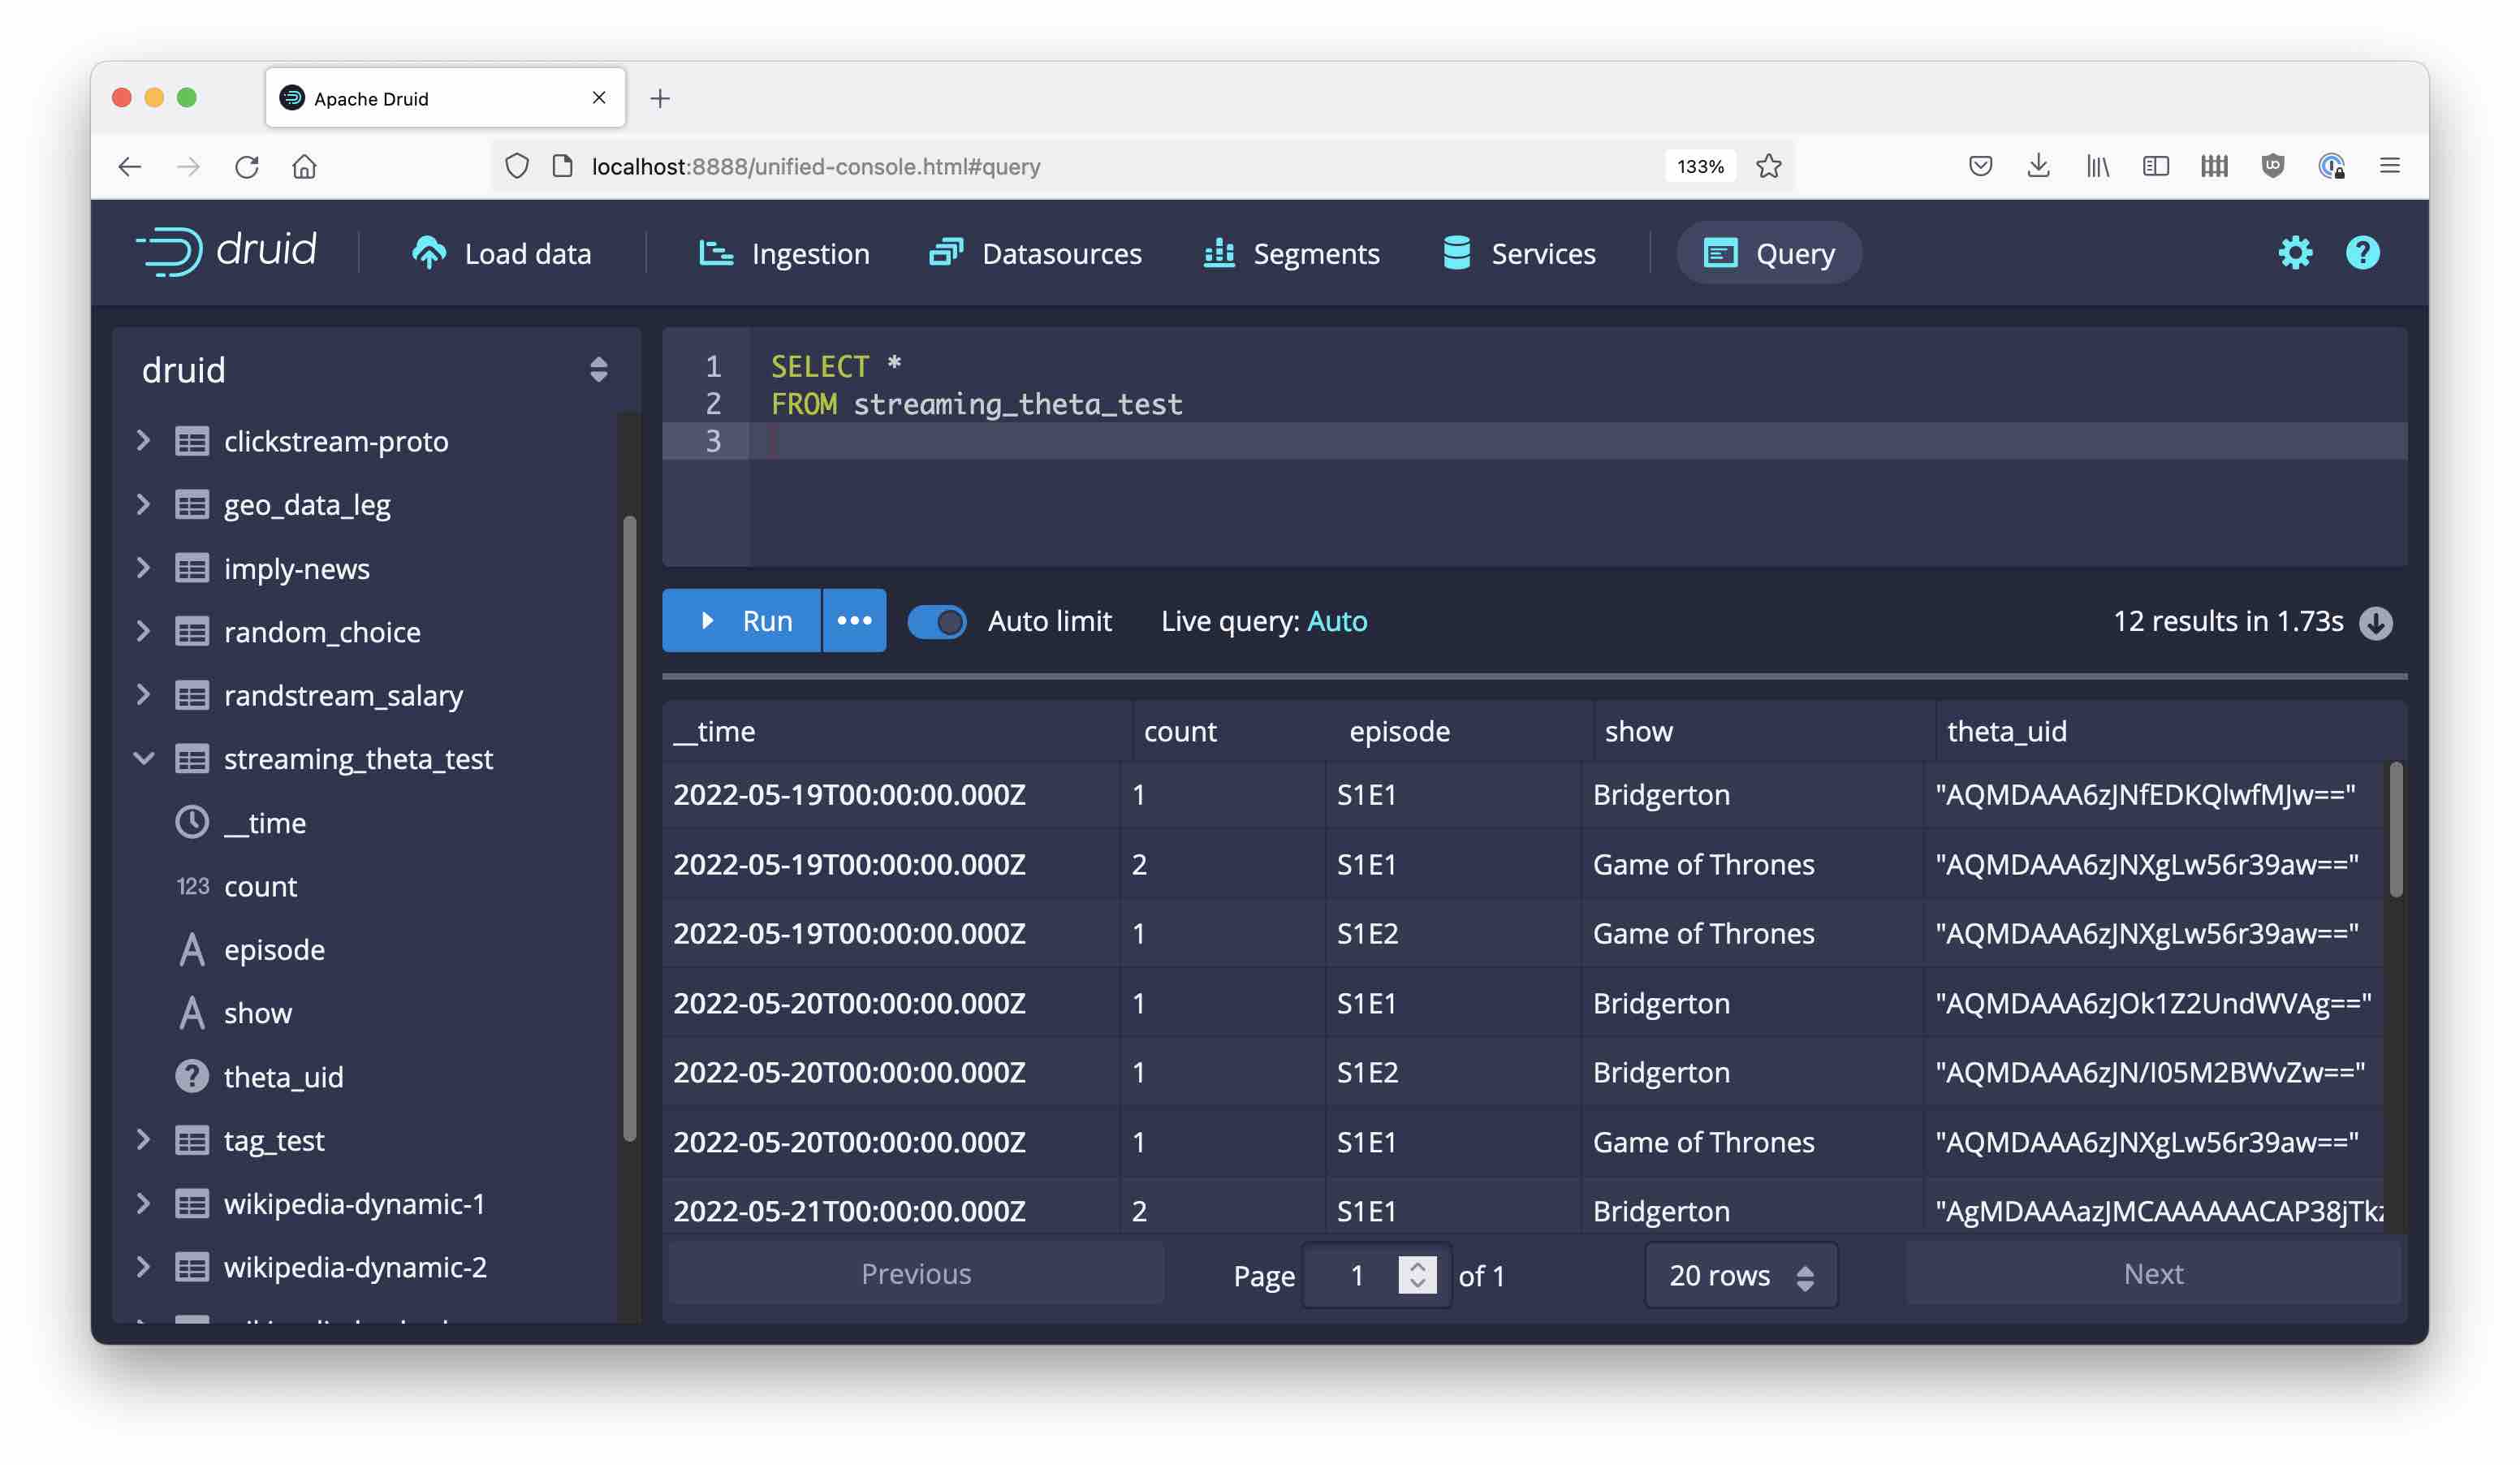
The theta sketch column appears as a base 64 encoded string, behind it is a bitmap.
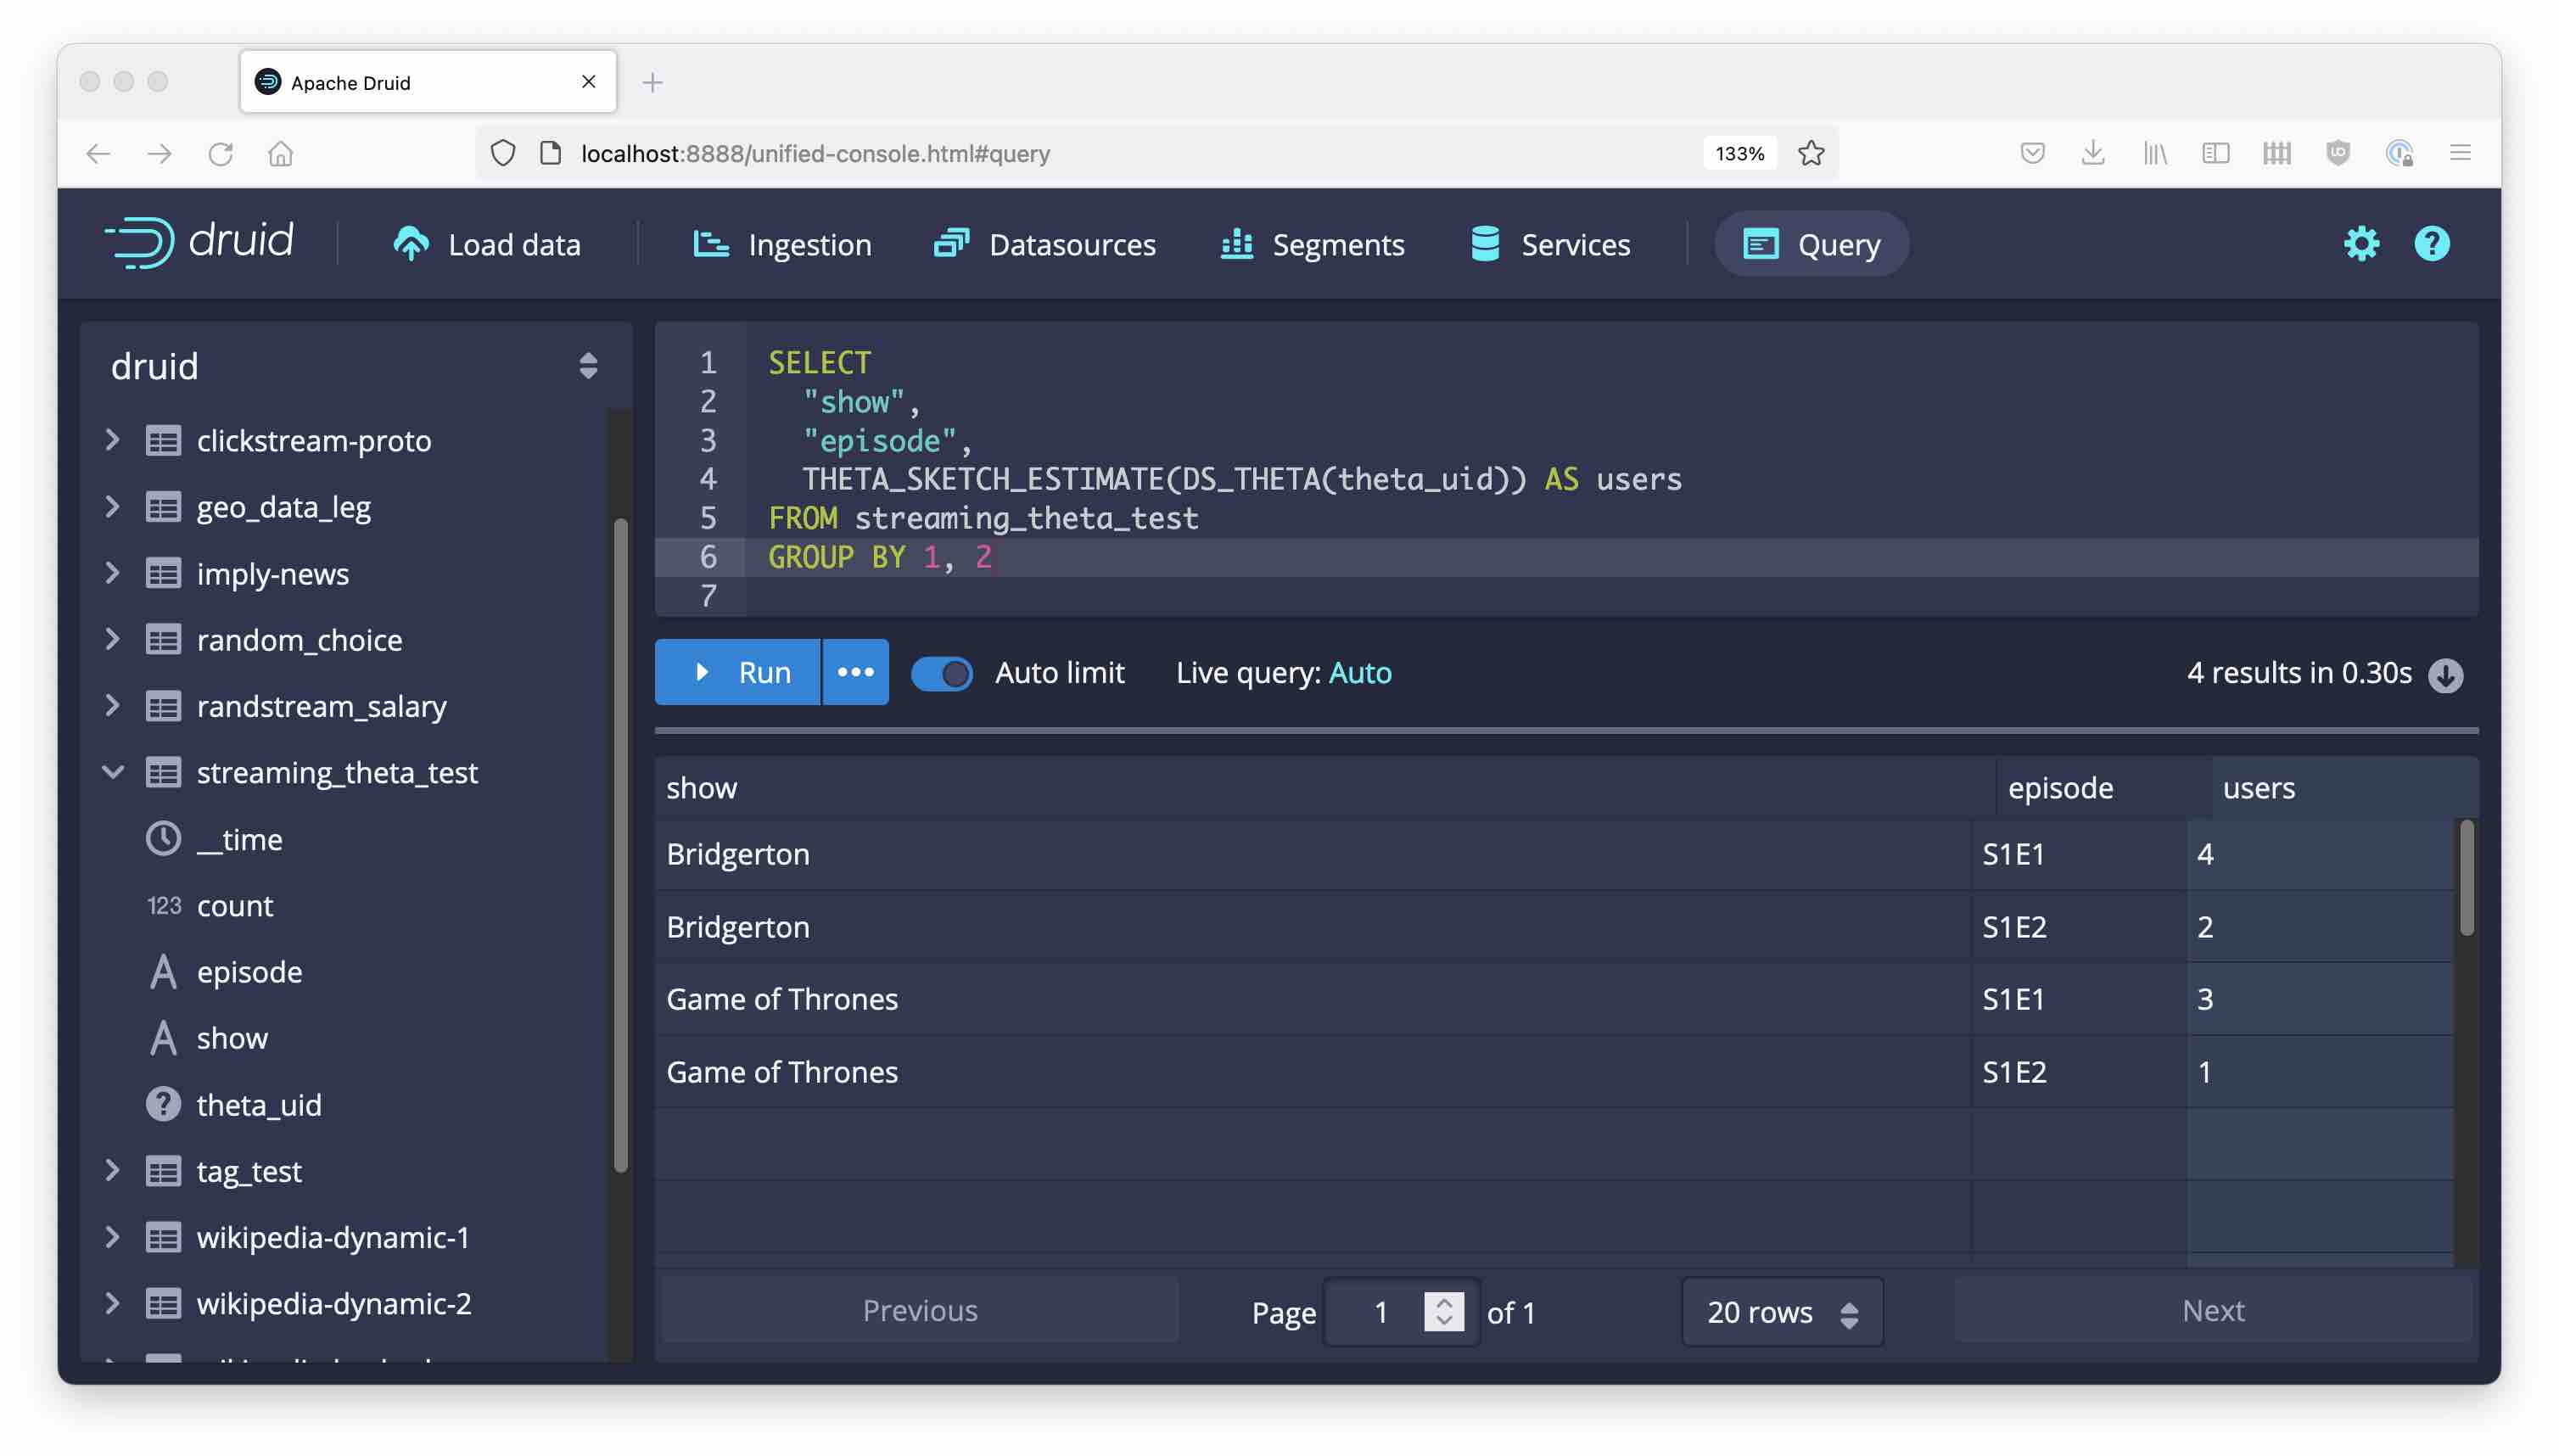
The simplest query would group by everything and use APPROX_COUNT_DISTINCT_DS_THETA instead of a conventional COUNT DISTINCT:
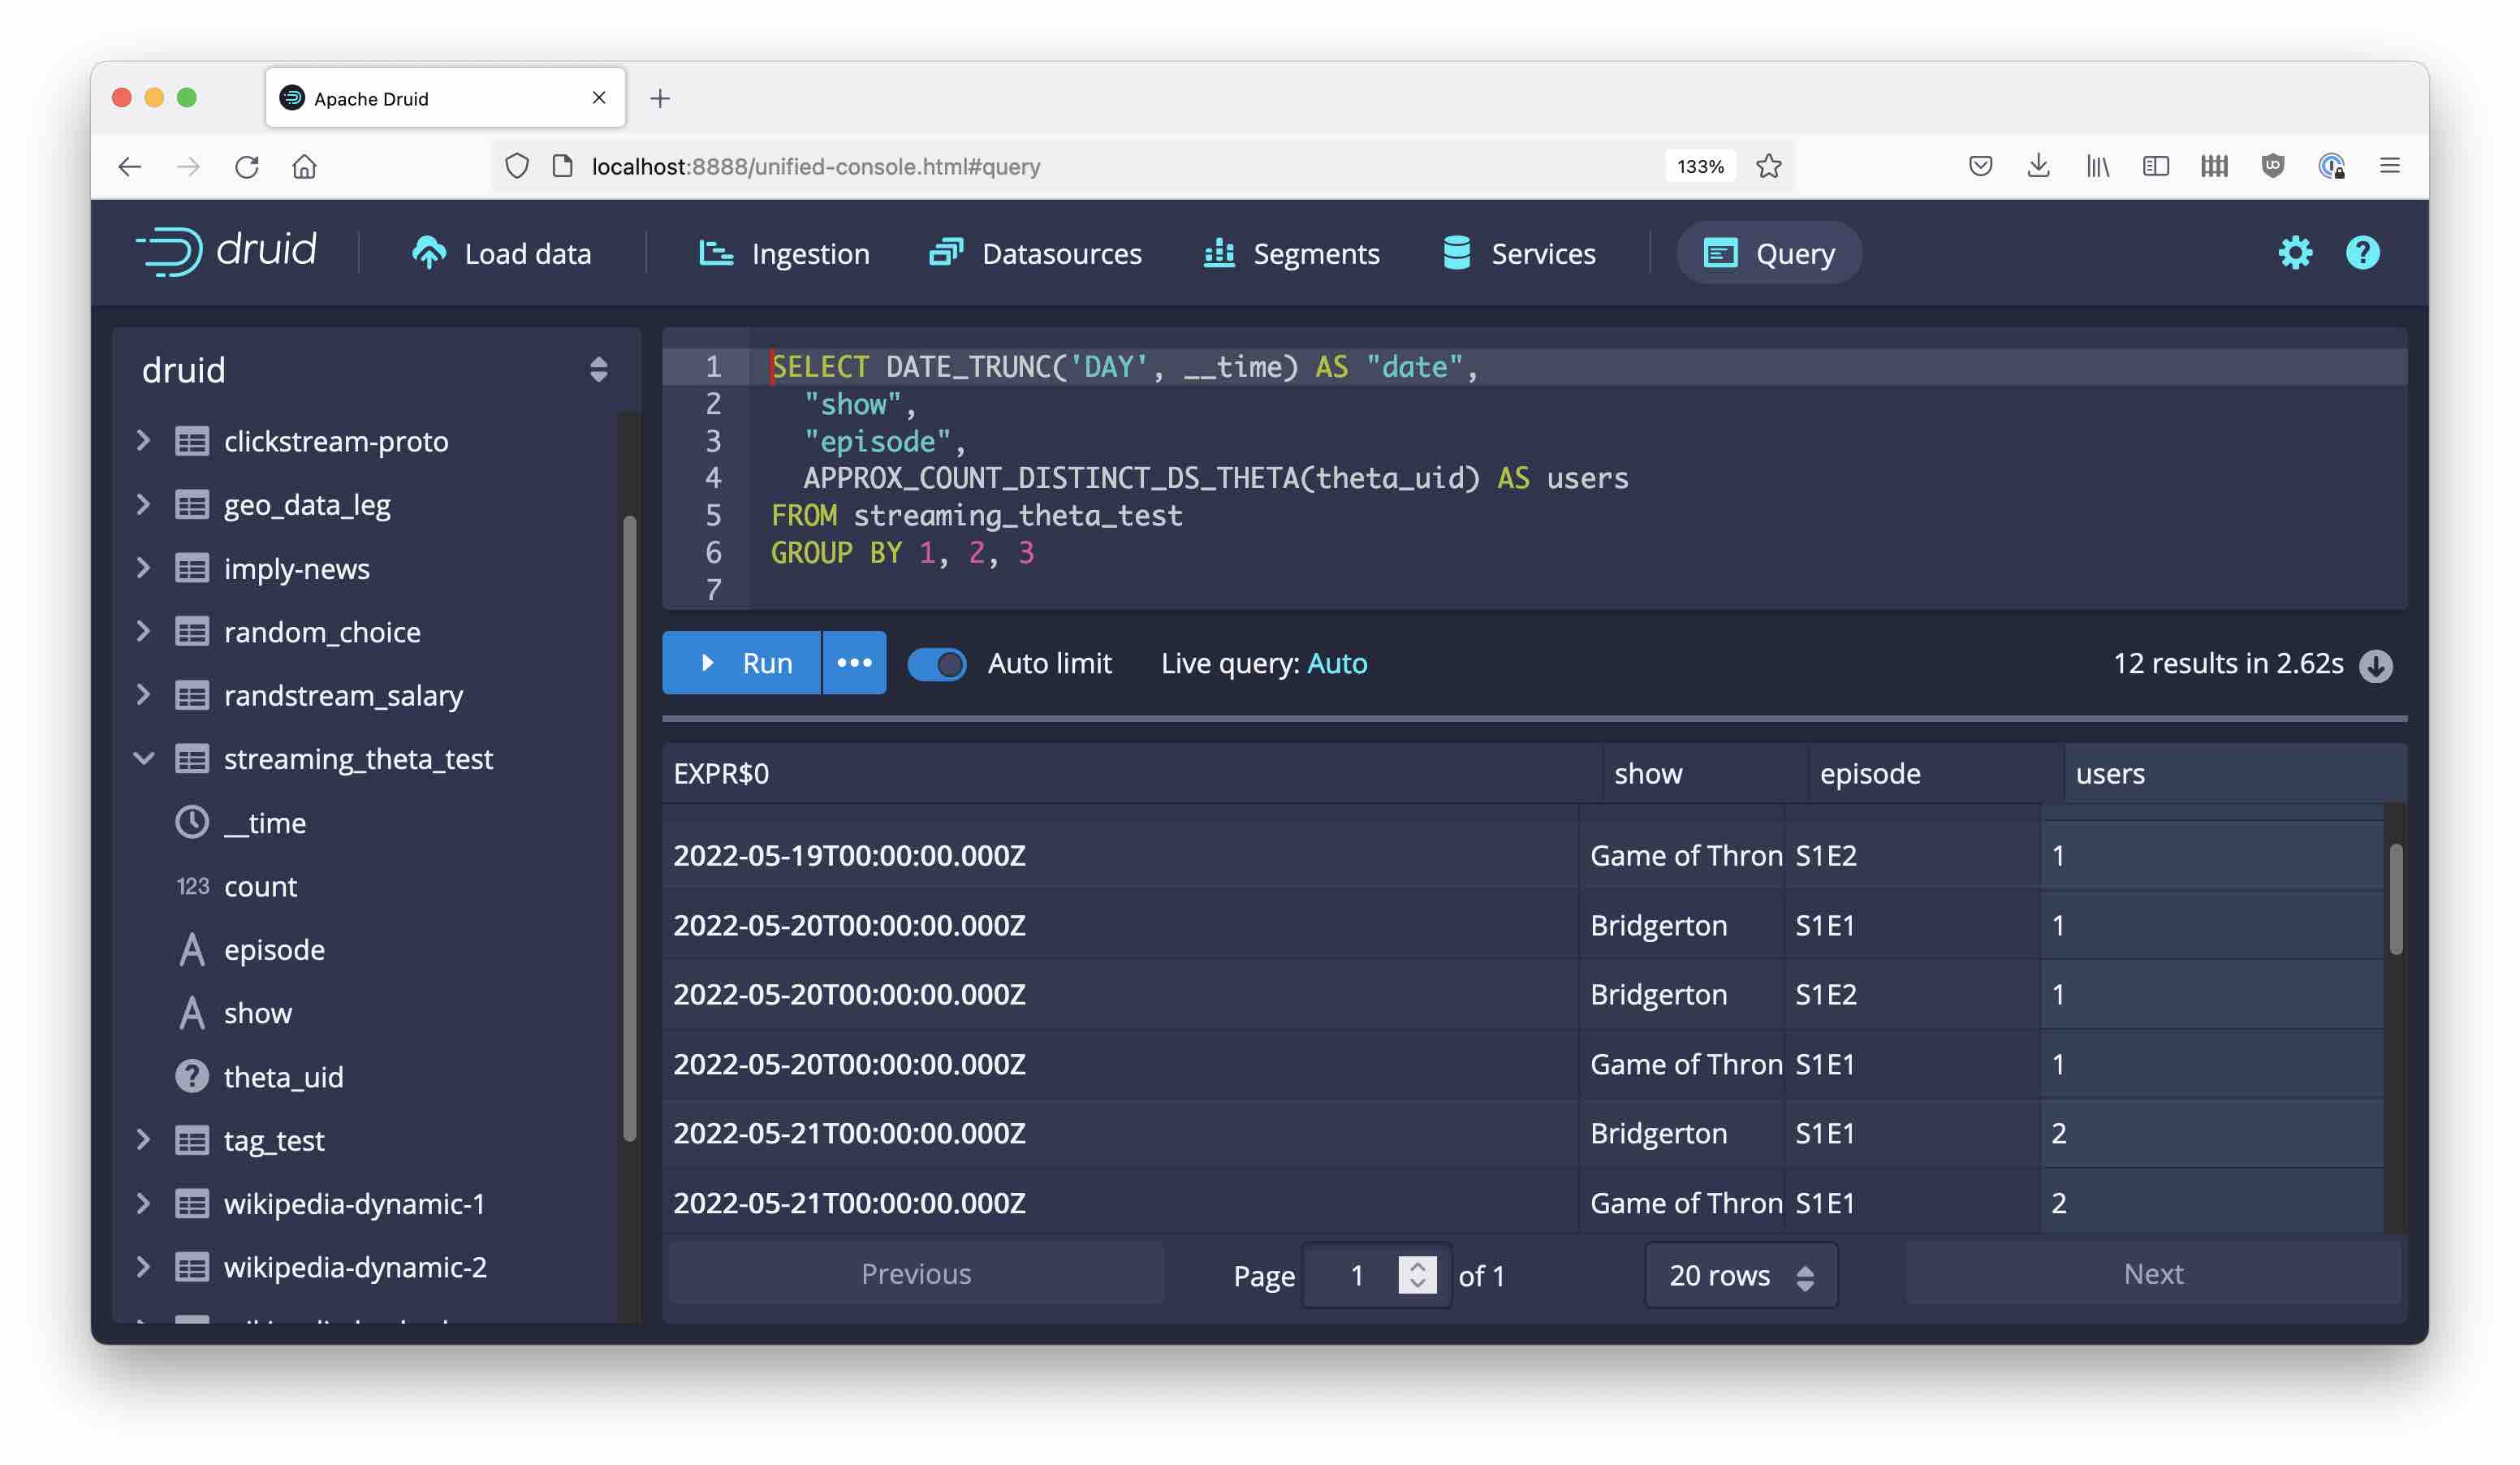
This is actually shorthand for the following query:
SELECT DATE_TRUNC('DAY', __time) AS "date",
  "show",
  "episode",
  THETA_SKETCH_ESTIMATE(DS_THETA(theta_uid)) AS users
FROM streaming_theta_test
GROUP BY 1, 2, 3
Here, the distinct count expression has been broken down into the theta sketch aggregator DS_THETA and the theta sketch estimator THETA_SKETCH_ESTIMATE.
We can run a similar query without the time breakdown:
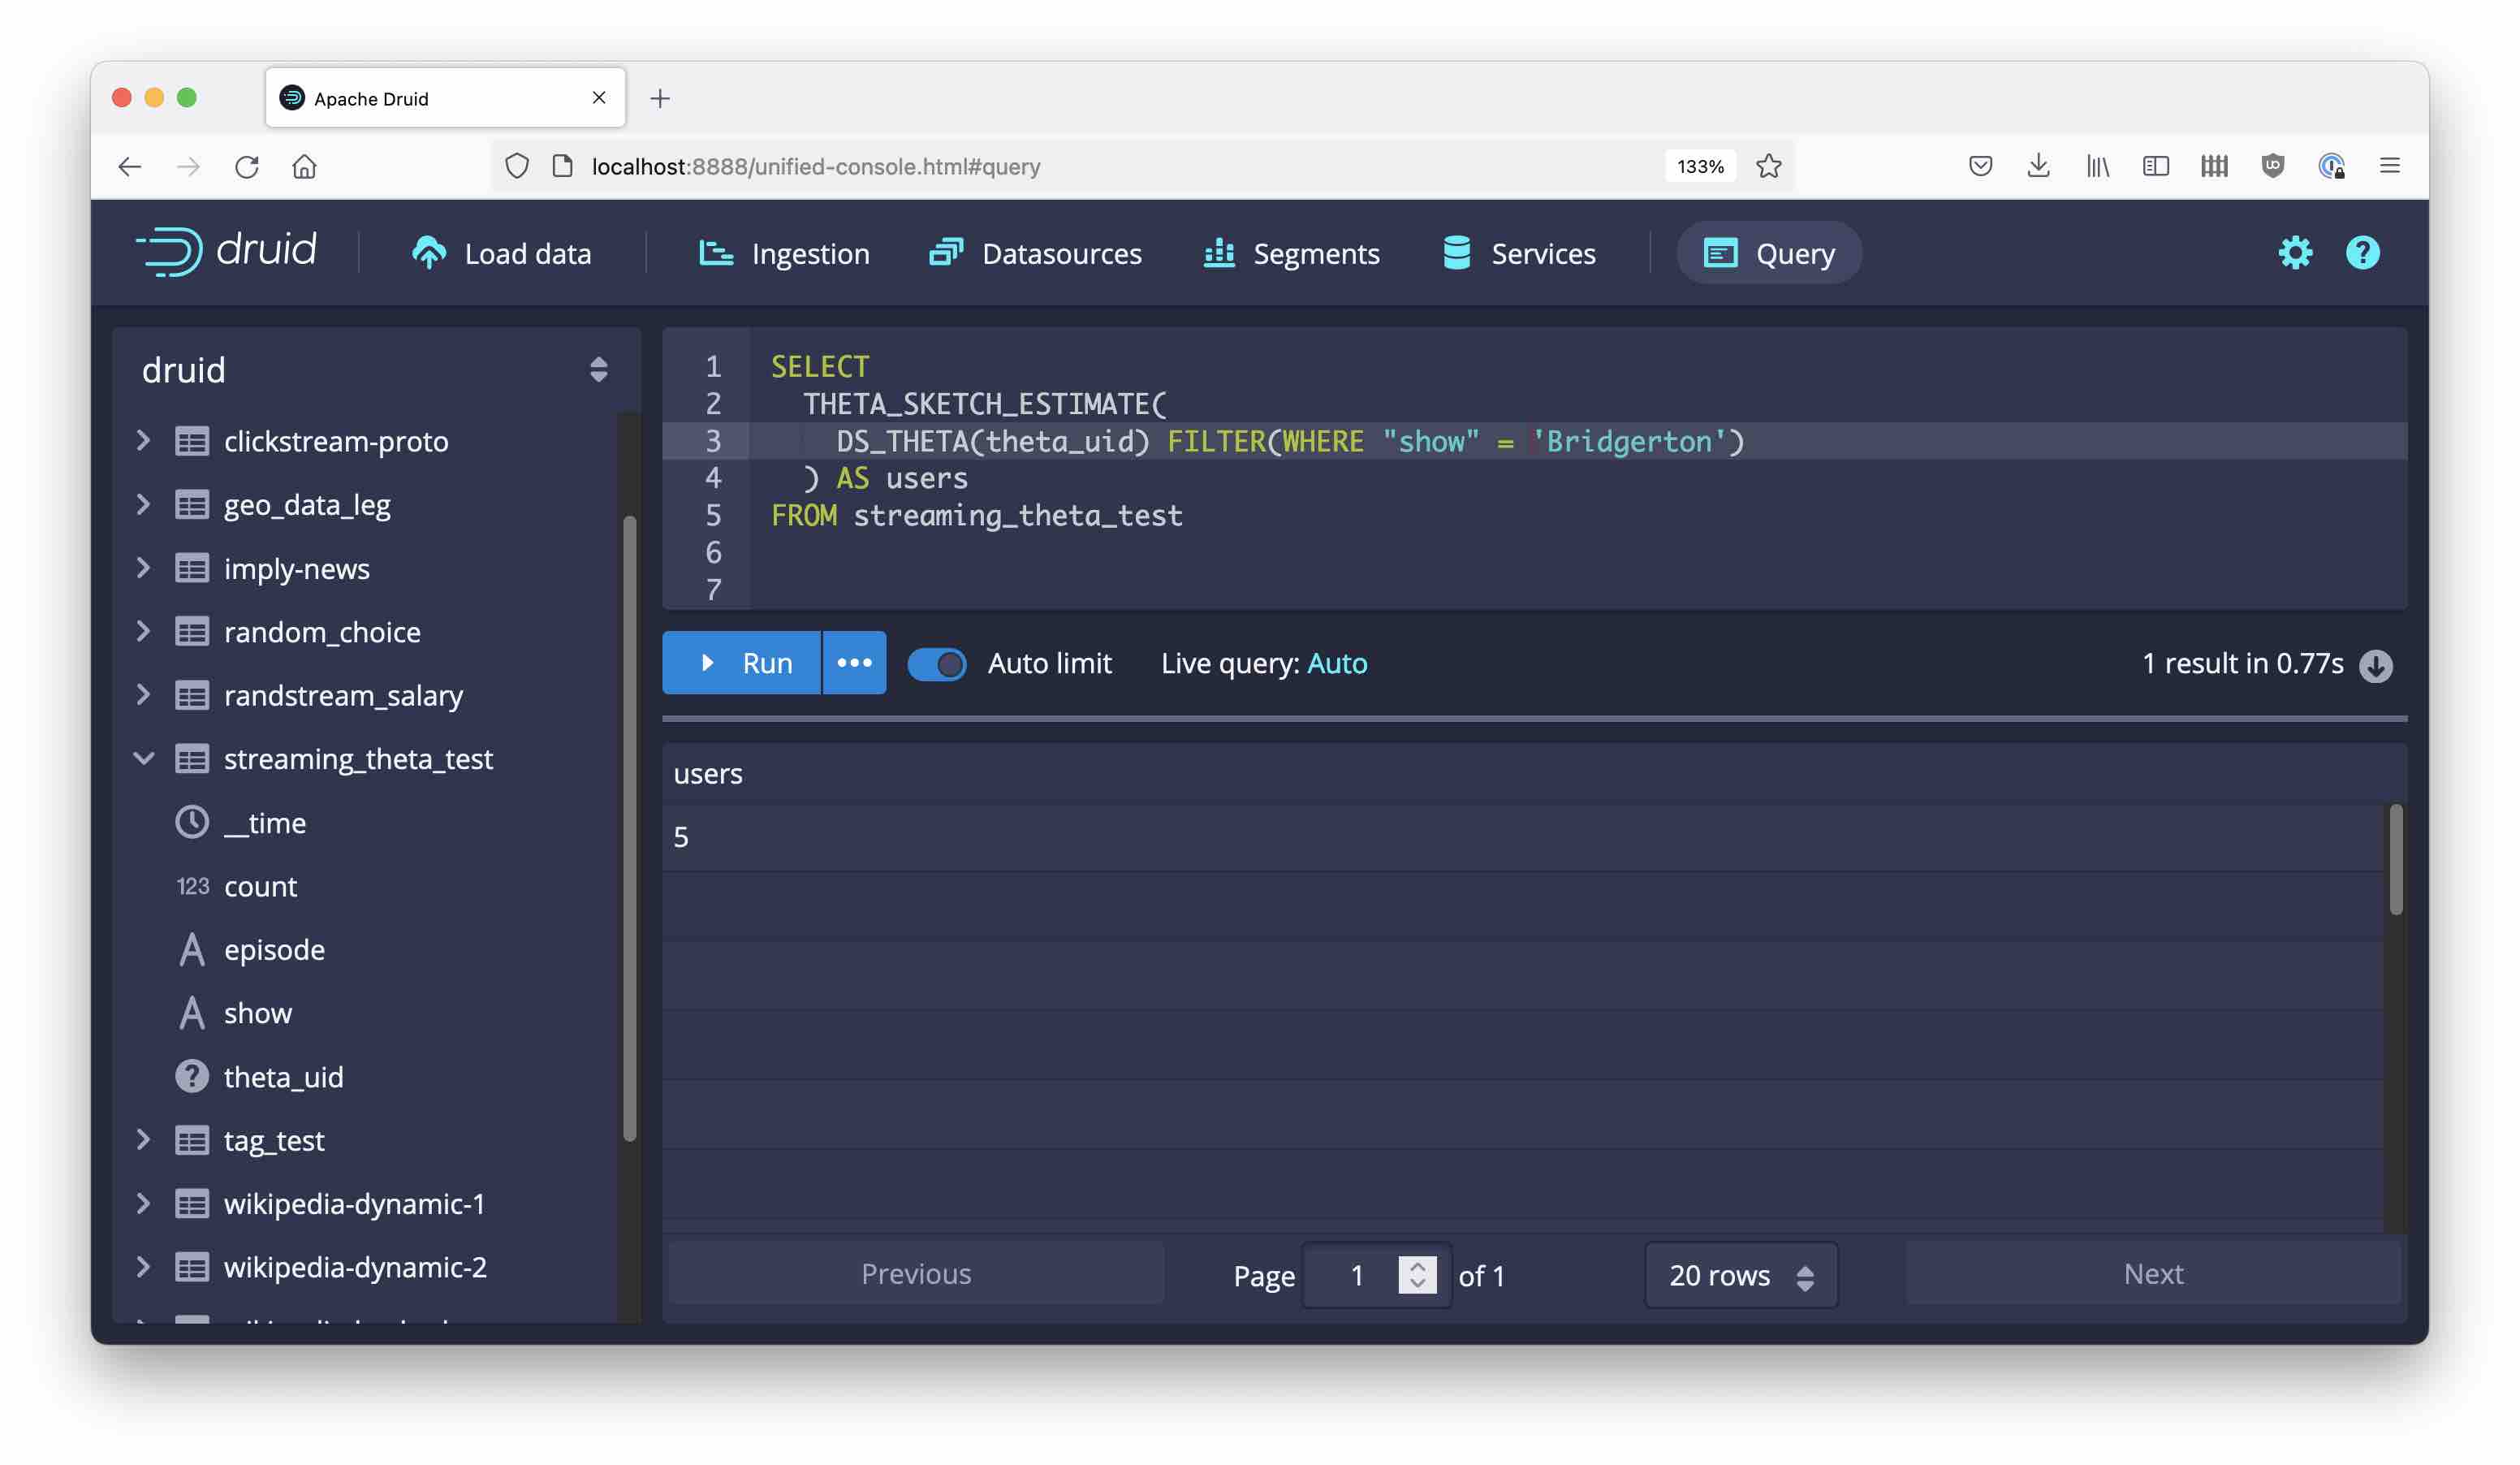
Filtered Metrics
Druid has the capability to use filtered metrics. This means we can include a WHERE clause in the SELECT part of the query. Note, that in the case of theta sketches, the filter clause has to be inserted between the aggregator and the estimator.
As an example, here’s the total unique users that watched Bridgerton:
Set Operations
We can use this capability of filtering in the aggregator, together with set operations, to finally answer the questions from above.
How many users watched both episodes of Bridgerton? Use THETA_SKETCH_INTERSECT to compute the unique count of the intersection of two (or more) segments:
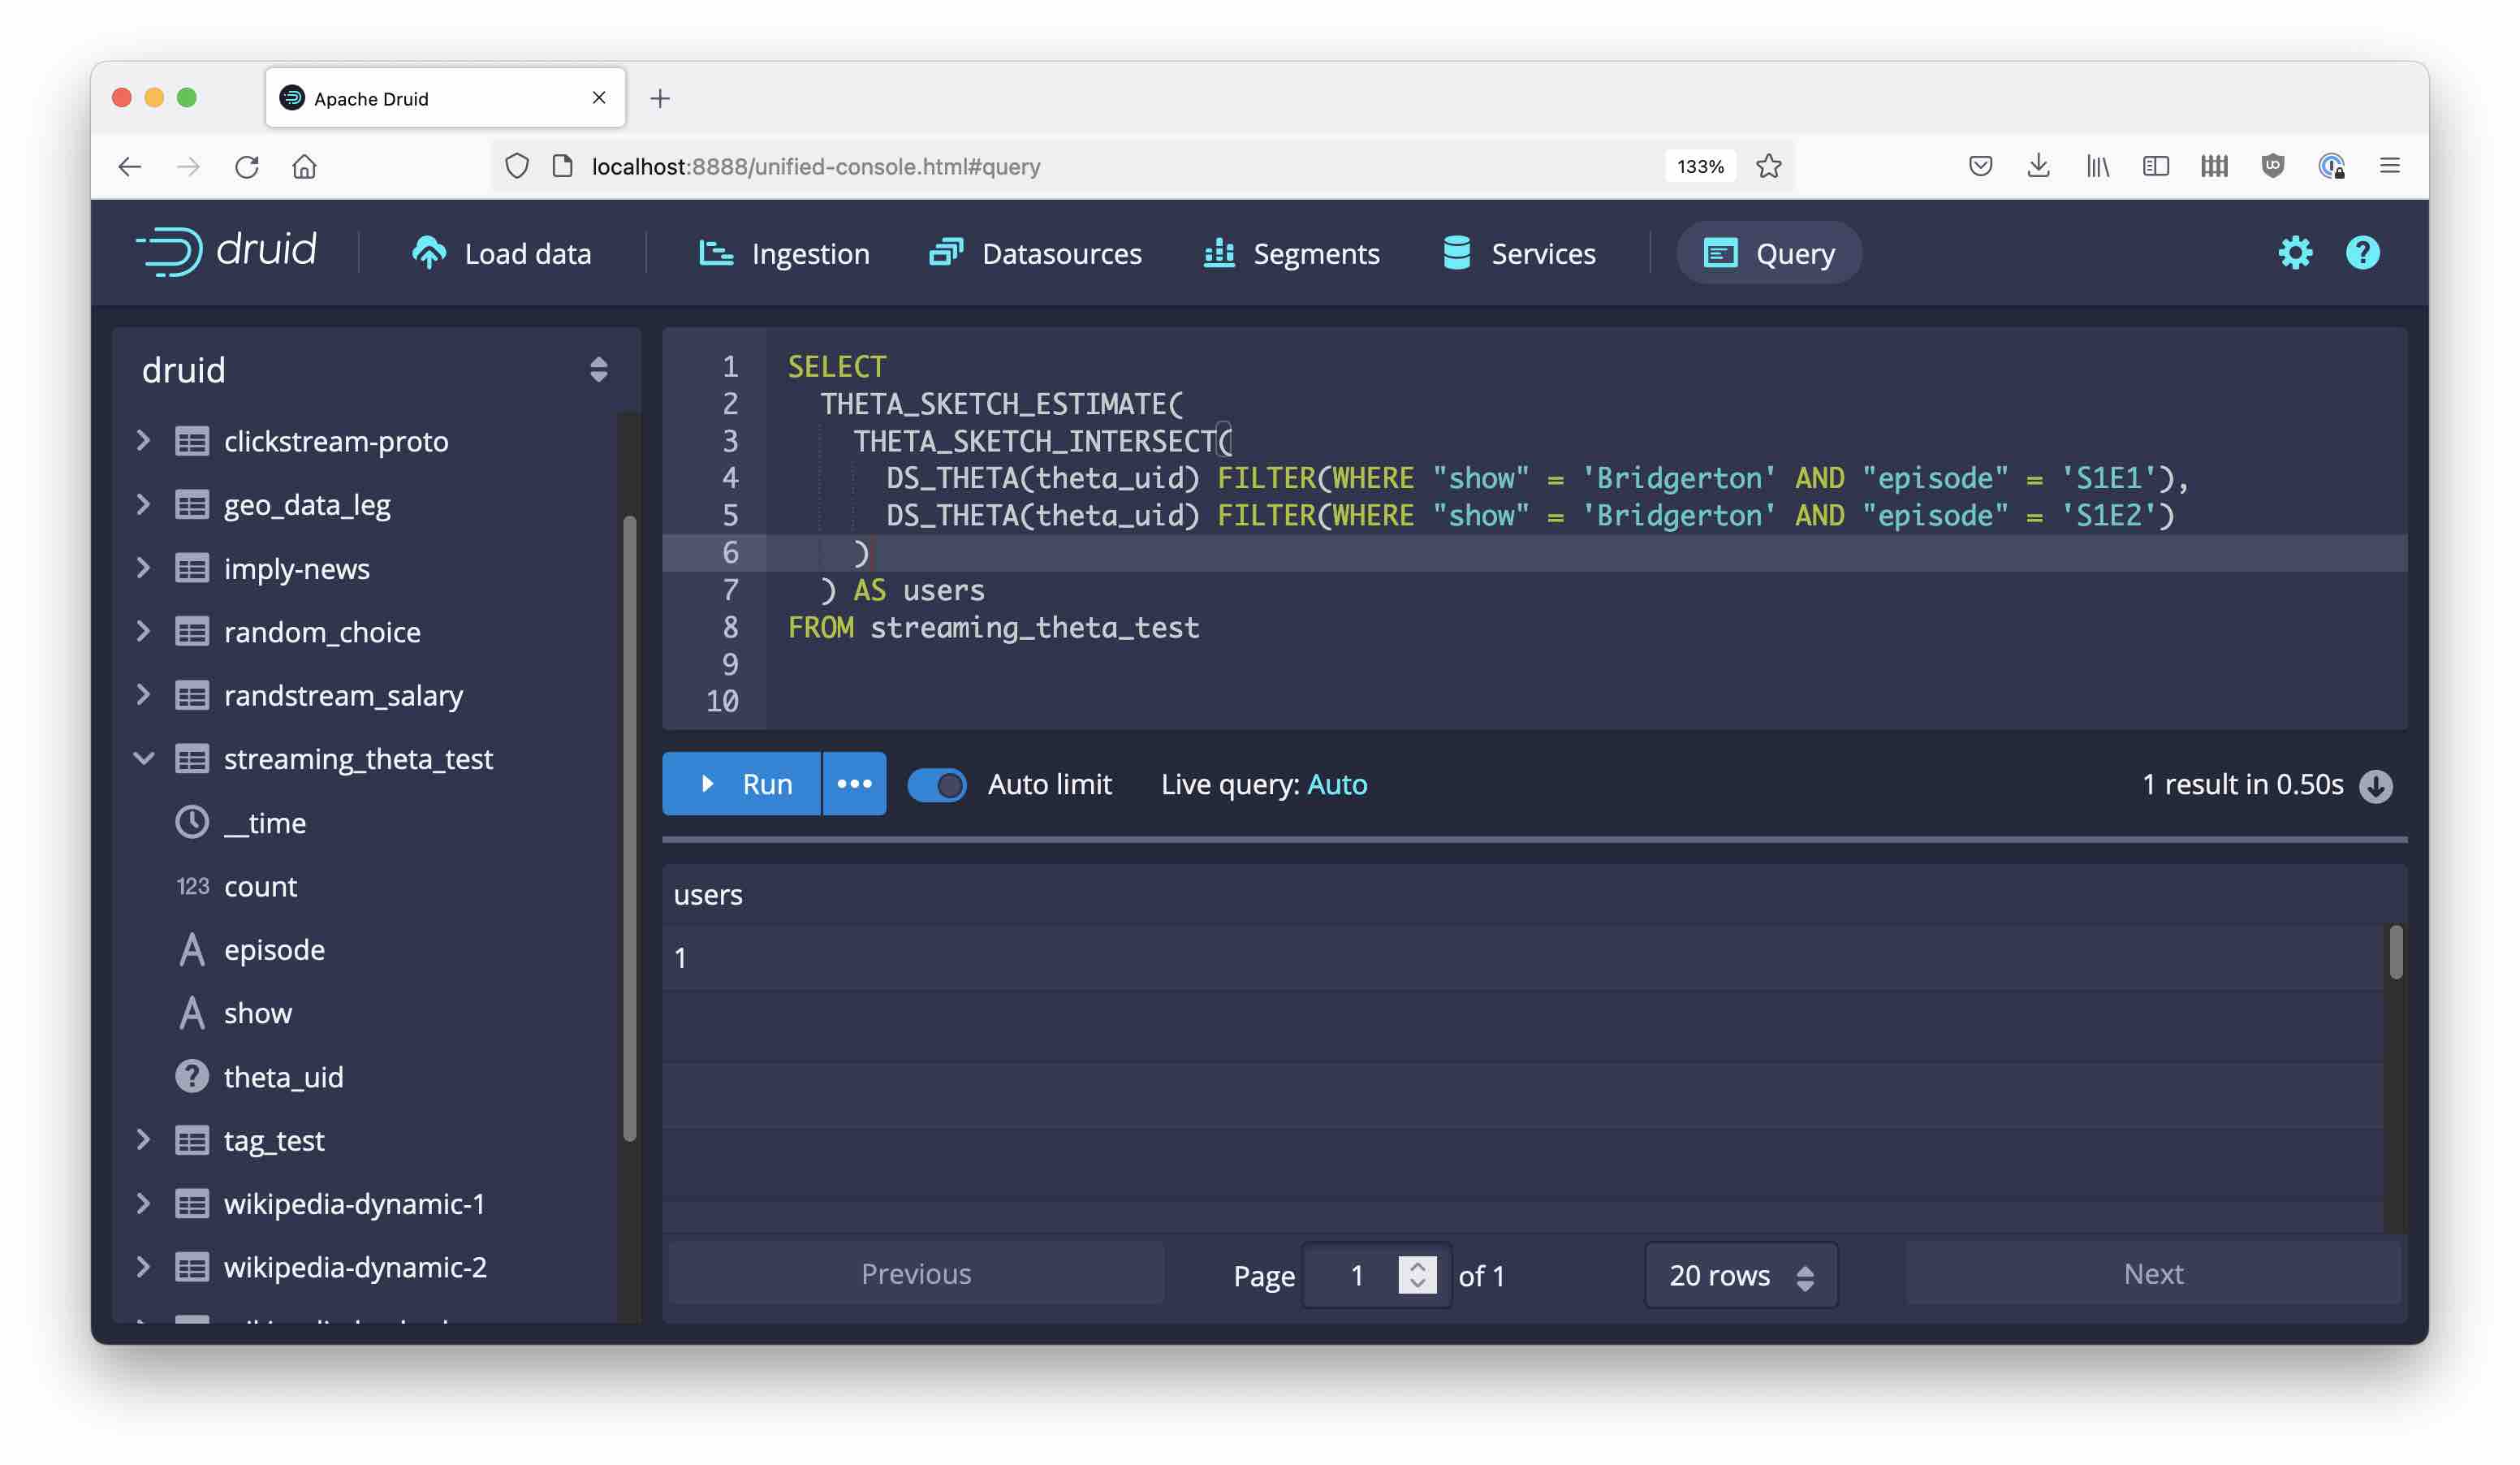
Again, the set function is spliced in between the aggregator and the estimator.
Likewise, use THETA_SKETCH_UNION to find the number of visitors that watched any of the episodes:

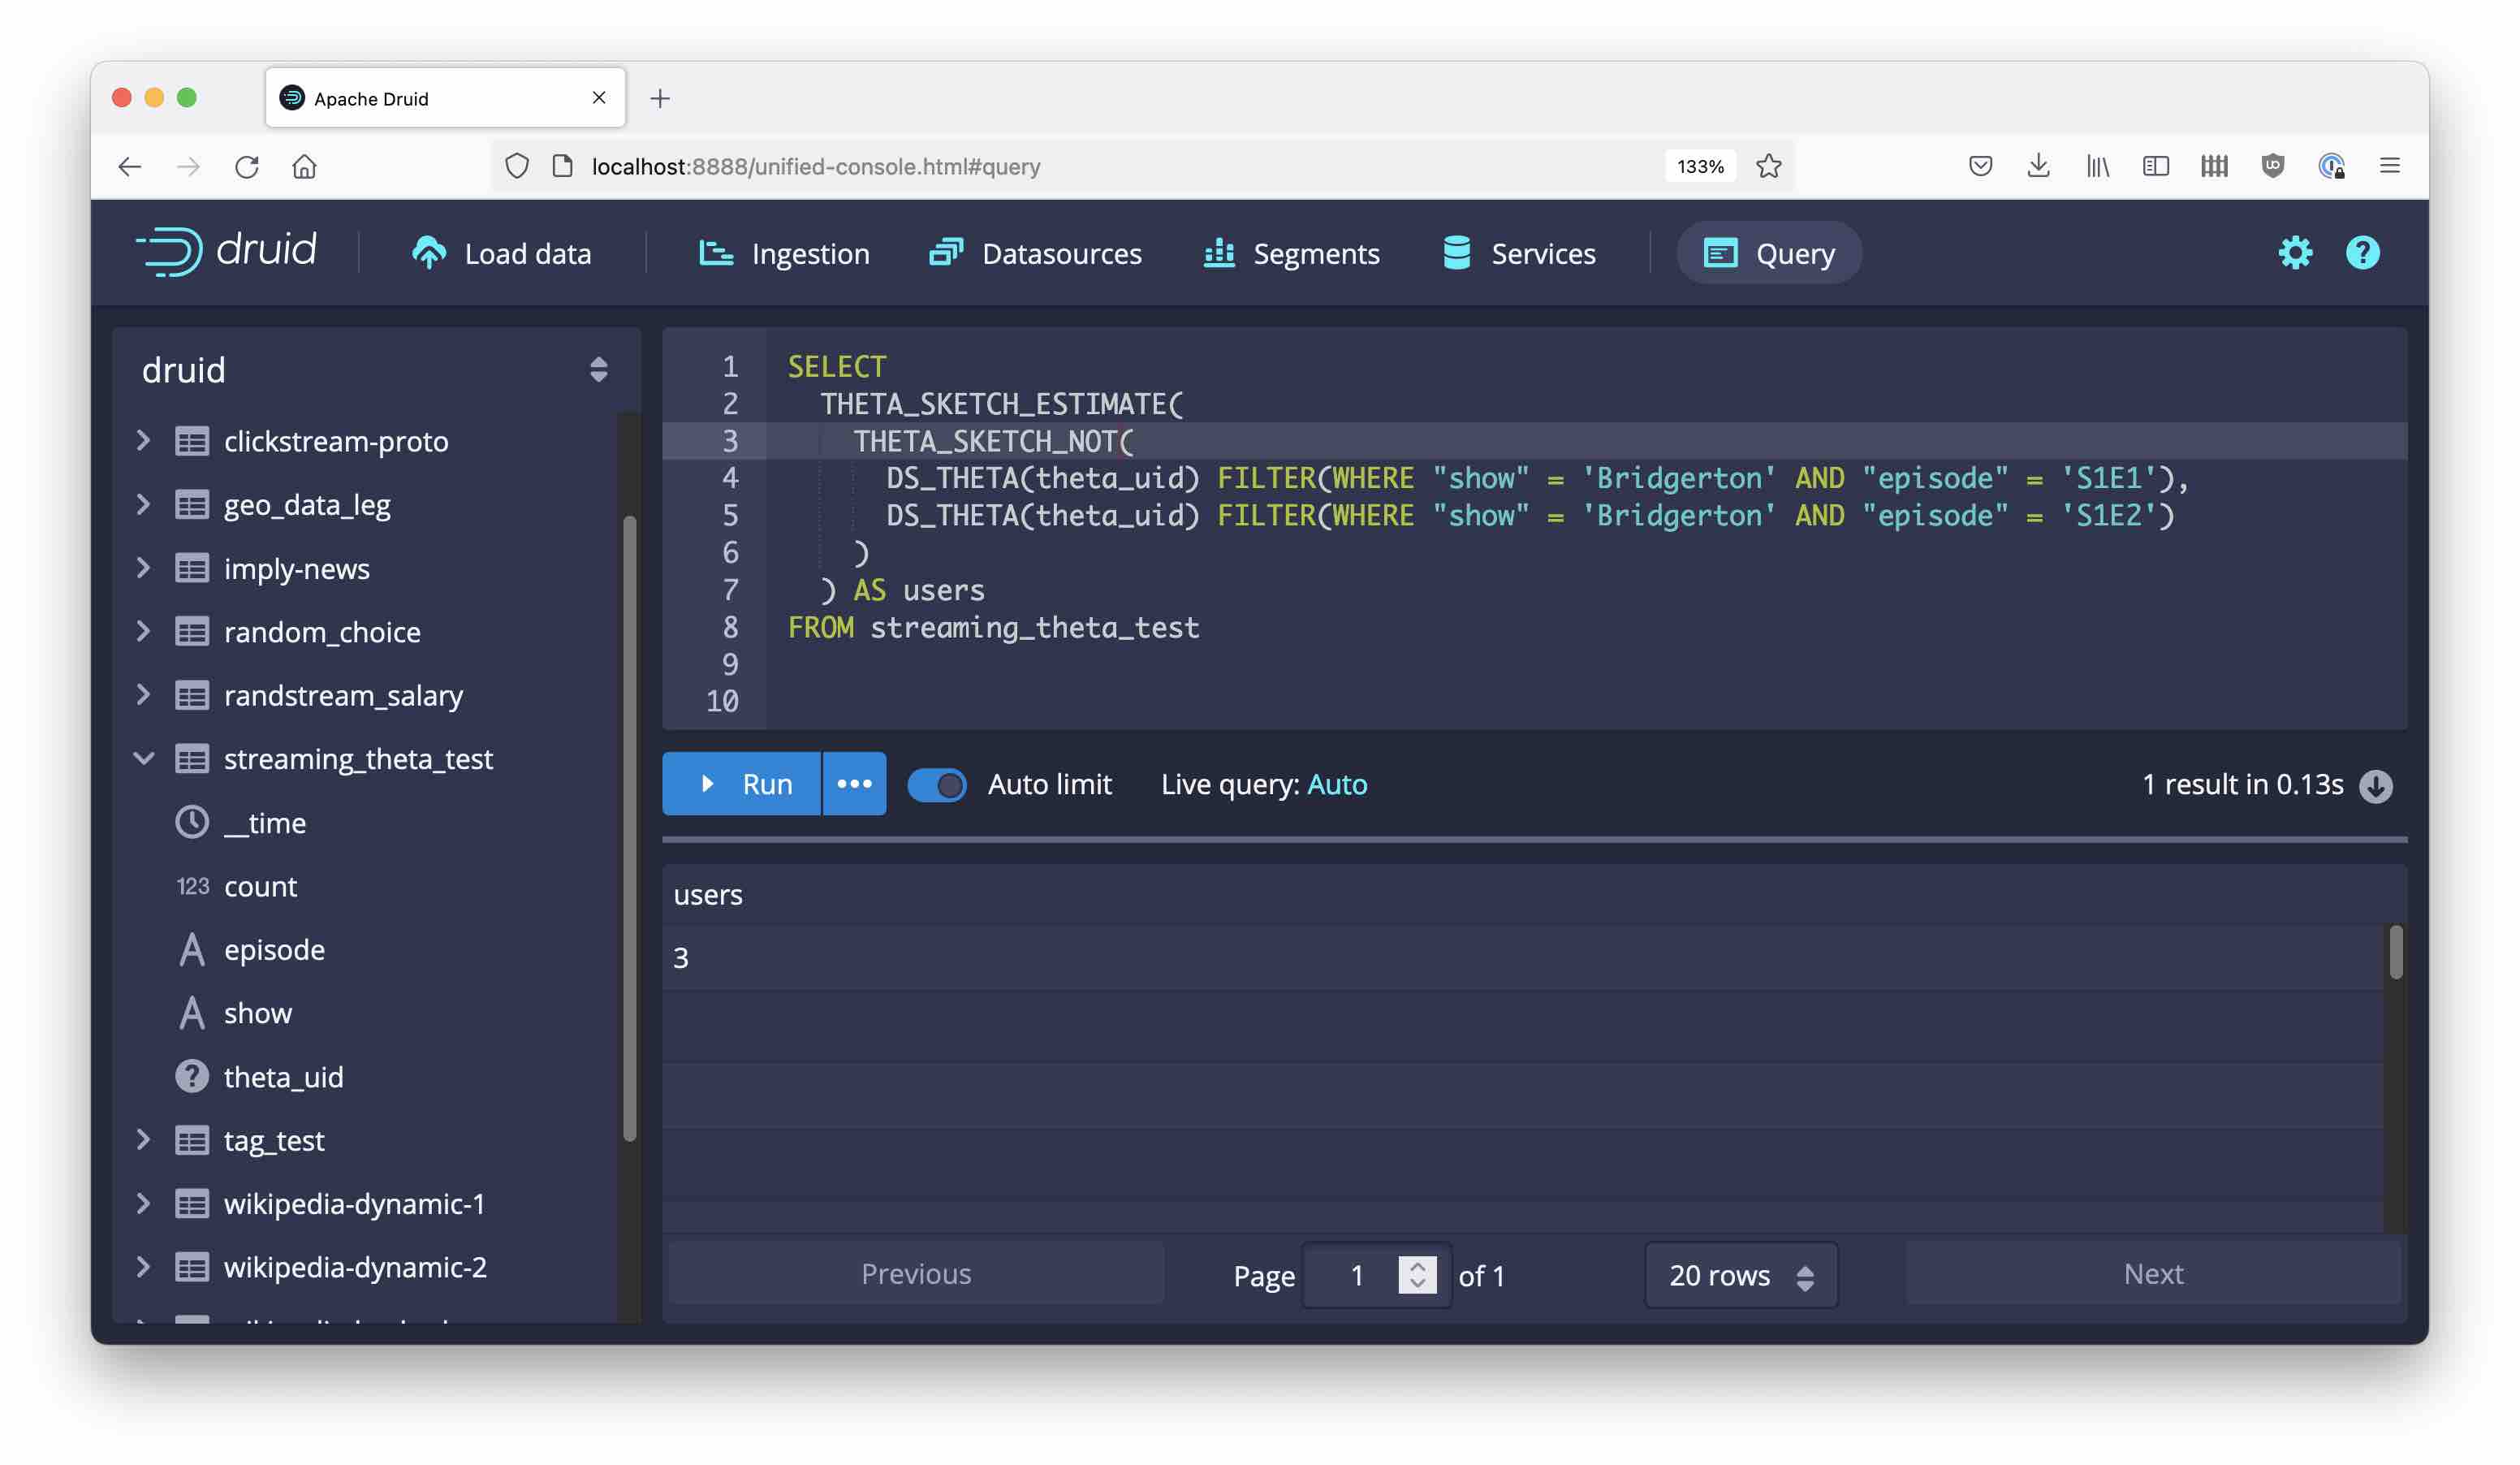
And finally, there is THETA_SKETCH_NOT which computes the set difference of two or more segments:
Learnings
- Counting distinct things for large data sets can be done with theta sketches in Apache Druid.
- This allows us to use rollup and discard the individual values, just retaining statistical approximations in the sketches.
- With theta sketch set operations, affinity analysis (which segments correlate or overlap by how much?) becomes easy.
“This image is taken from Page 500 of Praktisches Kochbuch für die gewöhnliche und feinere Küche” by Medical Heritage Library, Inc. is licensed under CC BY-NC-SA 2.0 ![]()
![]()
![]()
![]() .
.
-
You might think: why 15 minutes and not just 1 hour? One of my customers pointed out why: 15 minute intervals work better with international timezones because those are not always aligned by hour. India, for instance, is 30 minutes off, and Nepal is even 45 minutes off. With 15 minute aggregates, you can get hourly sums for any of those timezones, too!) ↩
-
Specifically, the accuracy of the result is governed by the size k of the theta sketch, and by the operations you perform. There’s a whole explanation in the datasketches documentation. There’s also a version of the sketch estimator
THETA_SKETCH_ESTIMATE_WITH_ERROR_BOUNDSwhich takes an additional integer parameter and returns the error boundaries for the result in a JSON object. ↩