Druid 29 Preview: Transposing Data with PIVOT and UNPIVOT

Imagine that you are tasked with getting a spreadsheet of sales data into Druid that looks like this:
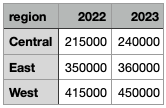
You’ve got the sales figures in the cells, and the regions down and the years across. While you can work with the data in this form in Druid, this may not be your best option. Druid 29 brings two new SQL functions that can help with transforming the data into a format that is better suited for analytics. Let’s see how that works!
Getting set up
This is a sneak peek into Druid 29 functionality. In order to use the new functions, you can (as of the time of writing) build Druid from the HEAD of the master branch:
git clone https://github.com/apache/druid.git
cd druid
mvn clean install -Pdist -DskipTests
Then follow the instructions to locate and install the tarball. Make sure you have the druid-multi-stage-query extension enabled.
In this tutorial, you will
- learn how to use the
PIVOTandUNPIVOTfunctions to transpose rows into columns and vice versa - and use this knowledge to transform a dataset during ingestion in Druid.
Disclaimer: This tutorial uses undocumented functionality and unreleased code. This blog is neither endorsed by Imply nor by the Apache Druid PMC. It merely collects the results of personal experiments. The features described here might, in the final release, work differently, or not at all. In addition, the entire build, or execution, may fail. Your mileage may vary.
Ingesting the data
The dataset is very simple and looks like this:
region,2022,2023
Central,215000,240000
East,350000,360000
West,415000,450000
The easiest way to get these data into Druid is with the ingestion wizard in the Druid console, using the Paste data input source:
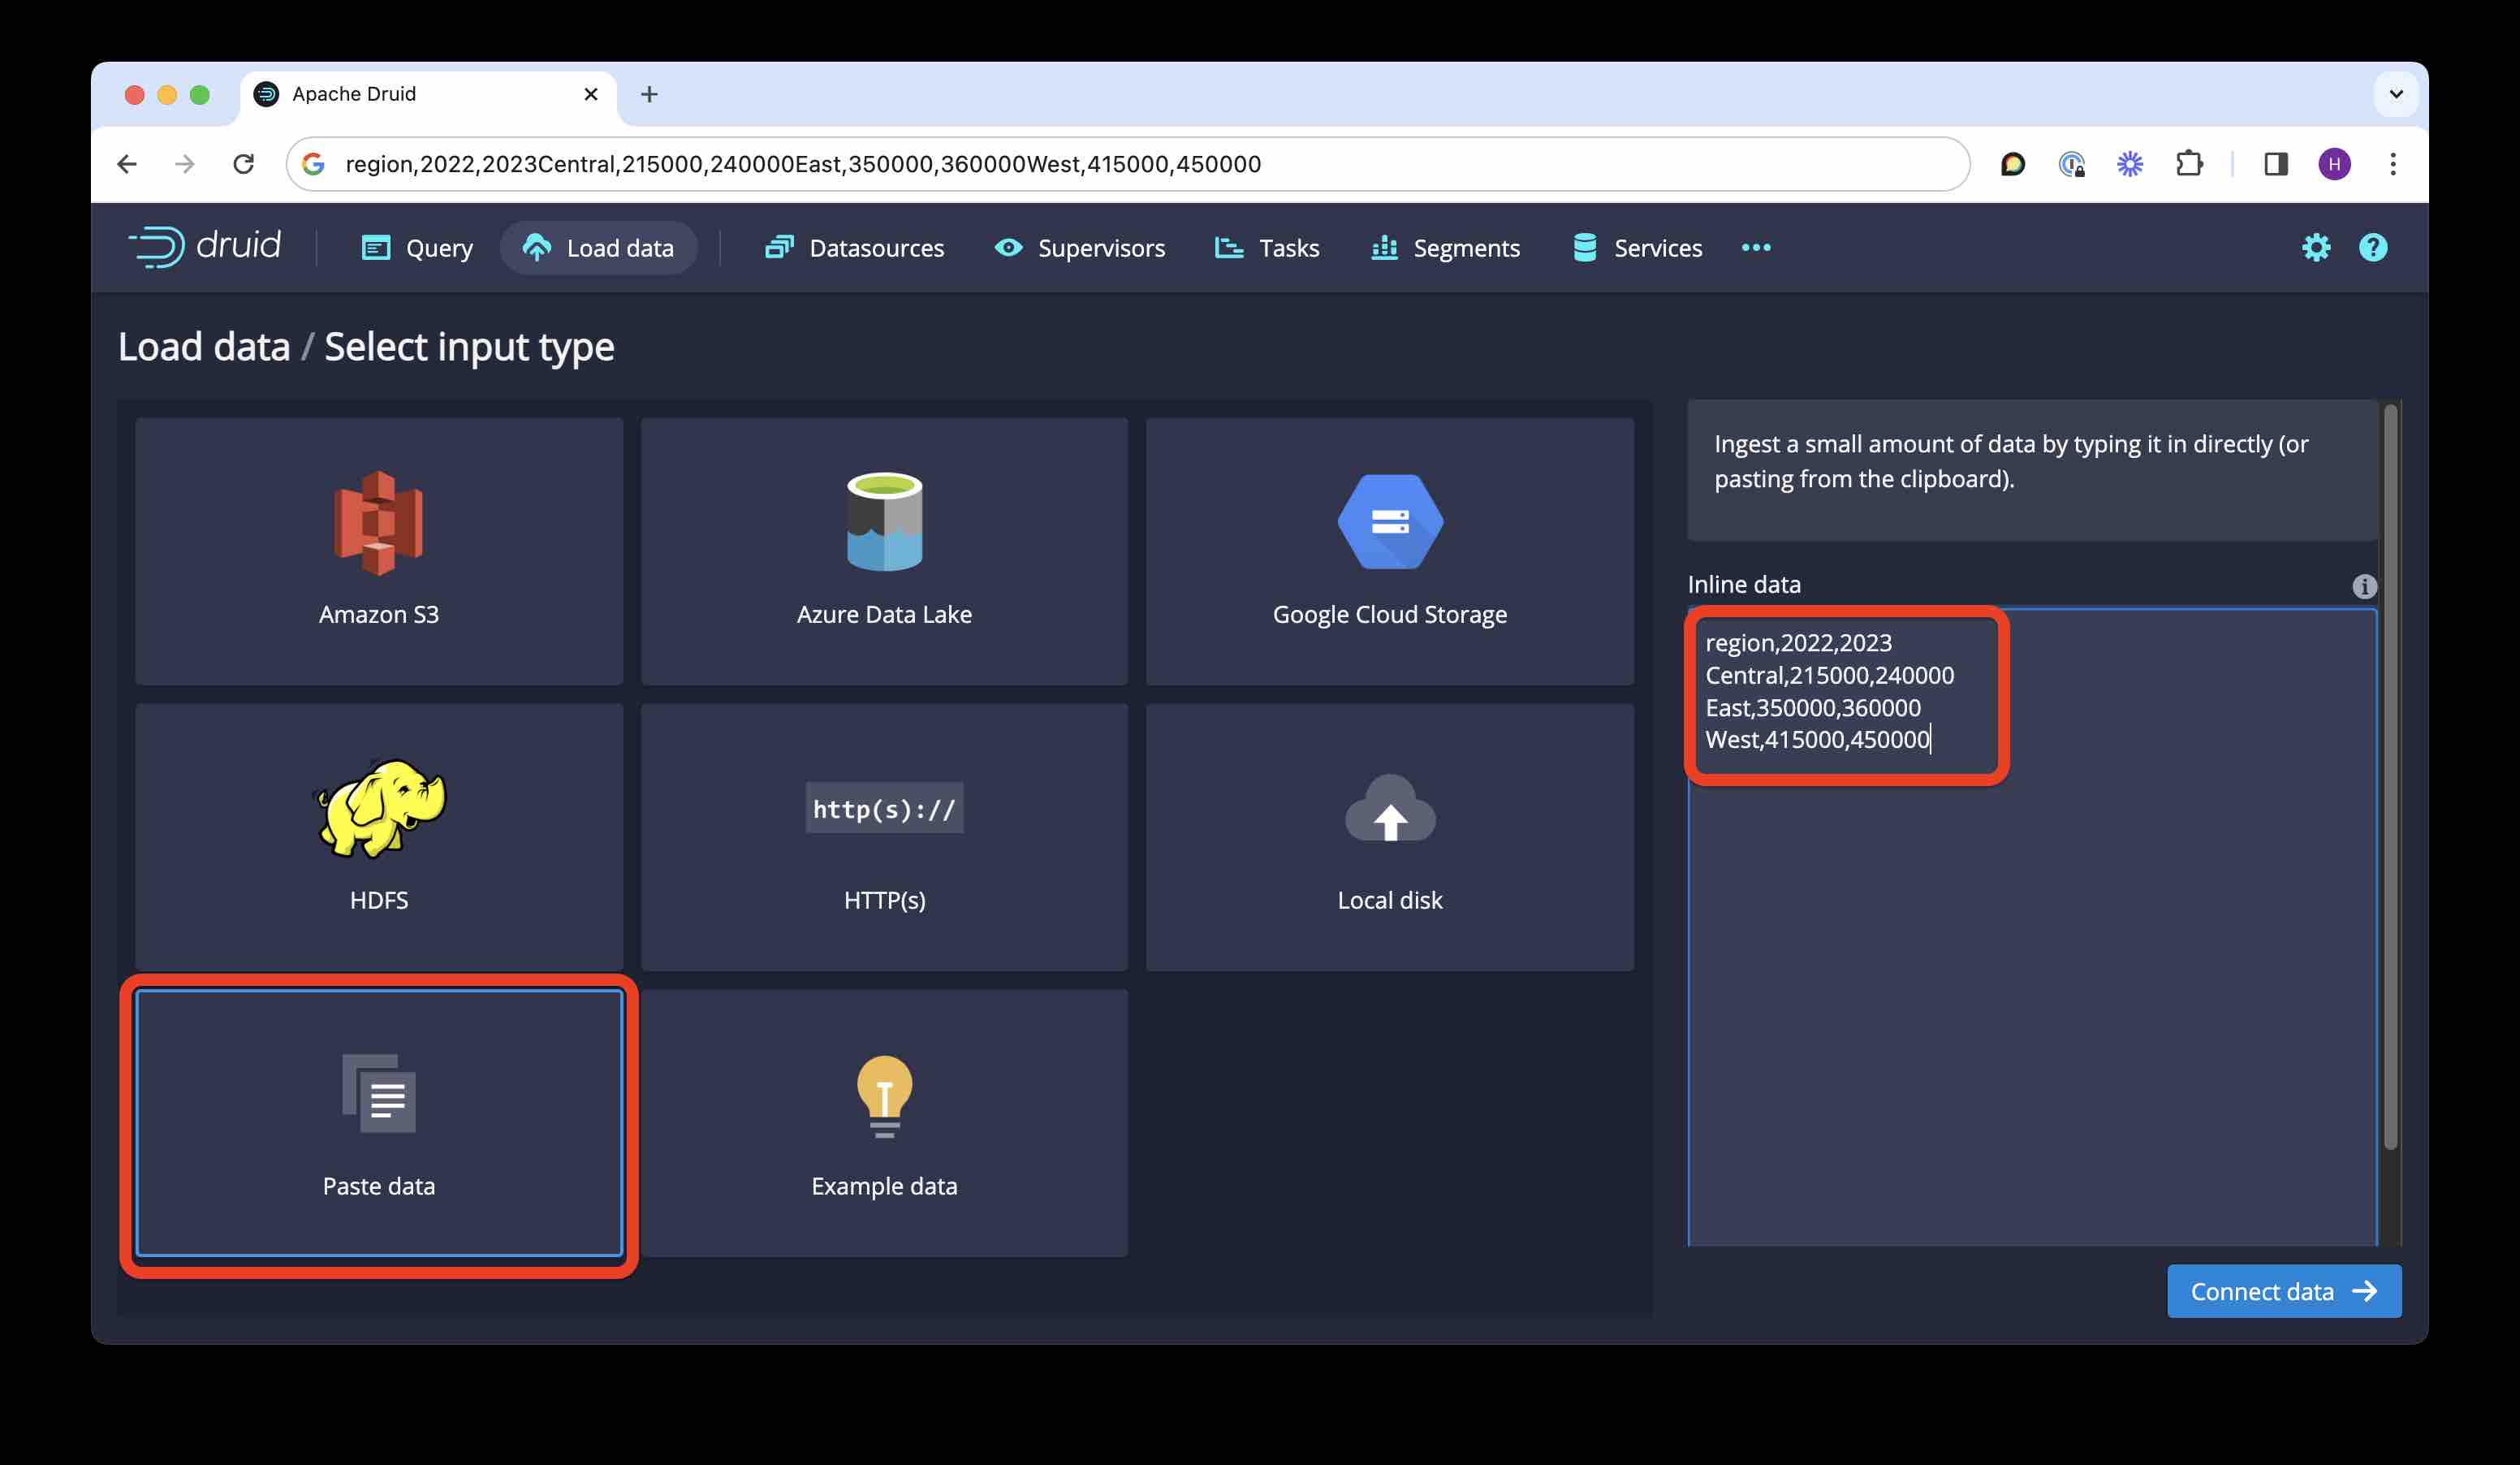
Run the ingestion wizard; make sure to give a meaningful name to the target datasource. Or you can paste the below SQL directly into a query window:
REPLACE INTO "sales_data" OVERWRITE ALL
WITH "ext" AS (
  SELECT *
  FROM TABLE(
    EXTERN(
      '{"type":"inline","data":"region,2022,2023\nCentral,215000,240000\nEast,350000,360000\nWest,415000,450000"}',
      '{"type":"csv","findColumnsFromHeader":true}'
    )
  ) EXTEND ("region" VARCHAR, "2022" BIGINT, "2023" BIGINT)
)
SELECT
  TIMESTAMP '2000-01-01 00:00:00' AS "__time",
  "region",
  "2022",
  "2023"
FROM "ext"
PARTITIONED BY ALL
PIVOT - transpose rows to columns
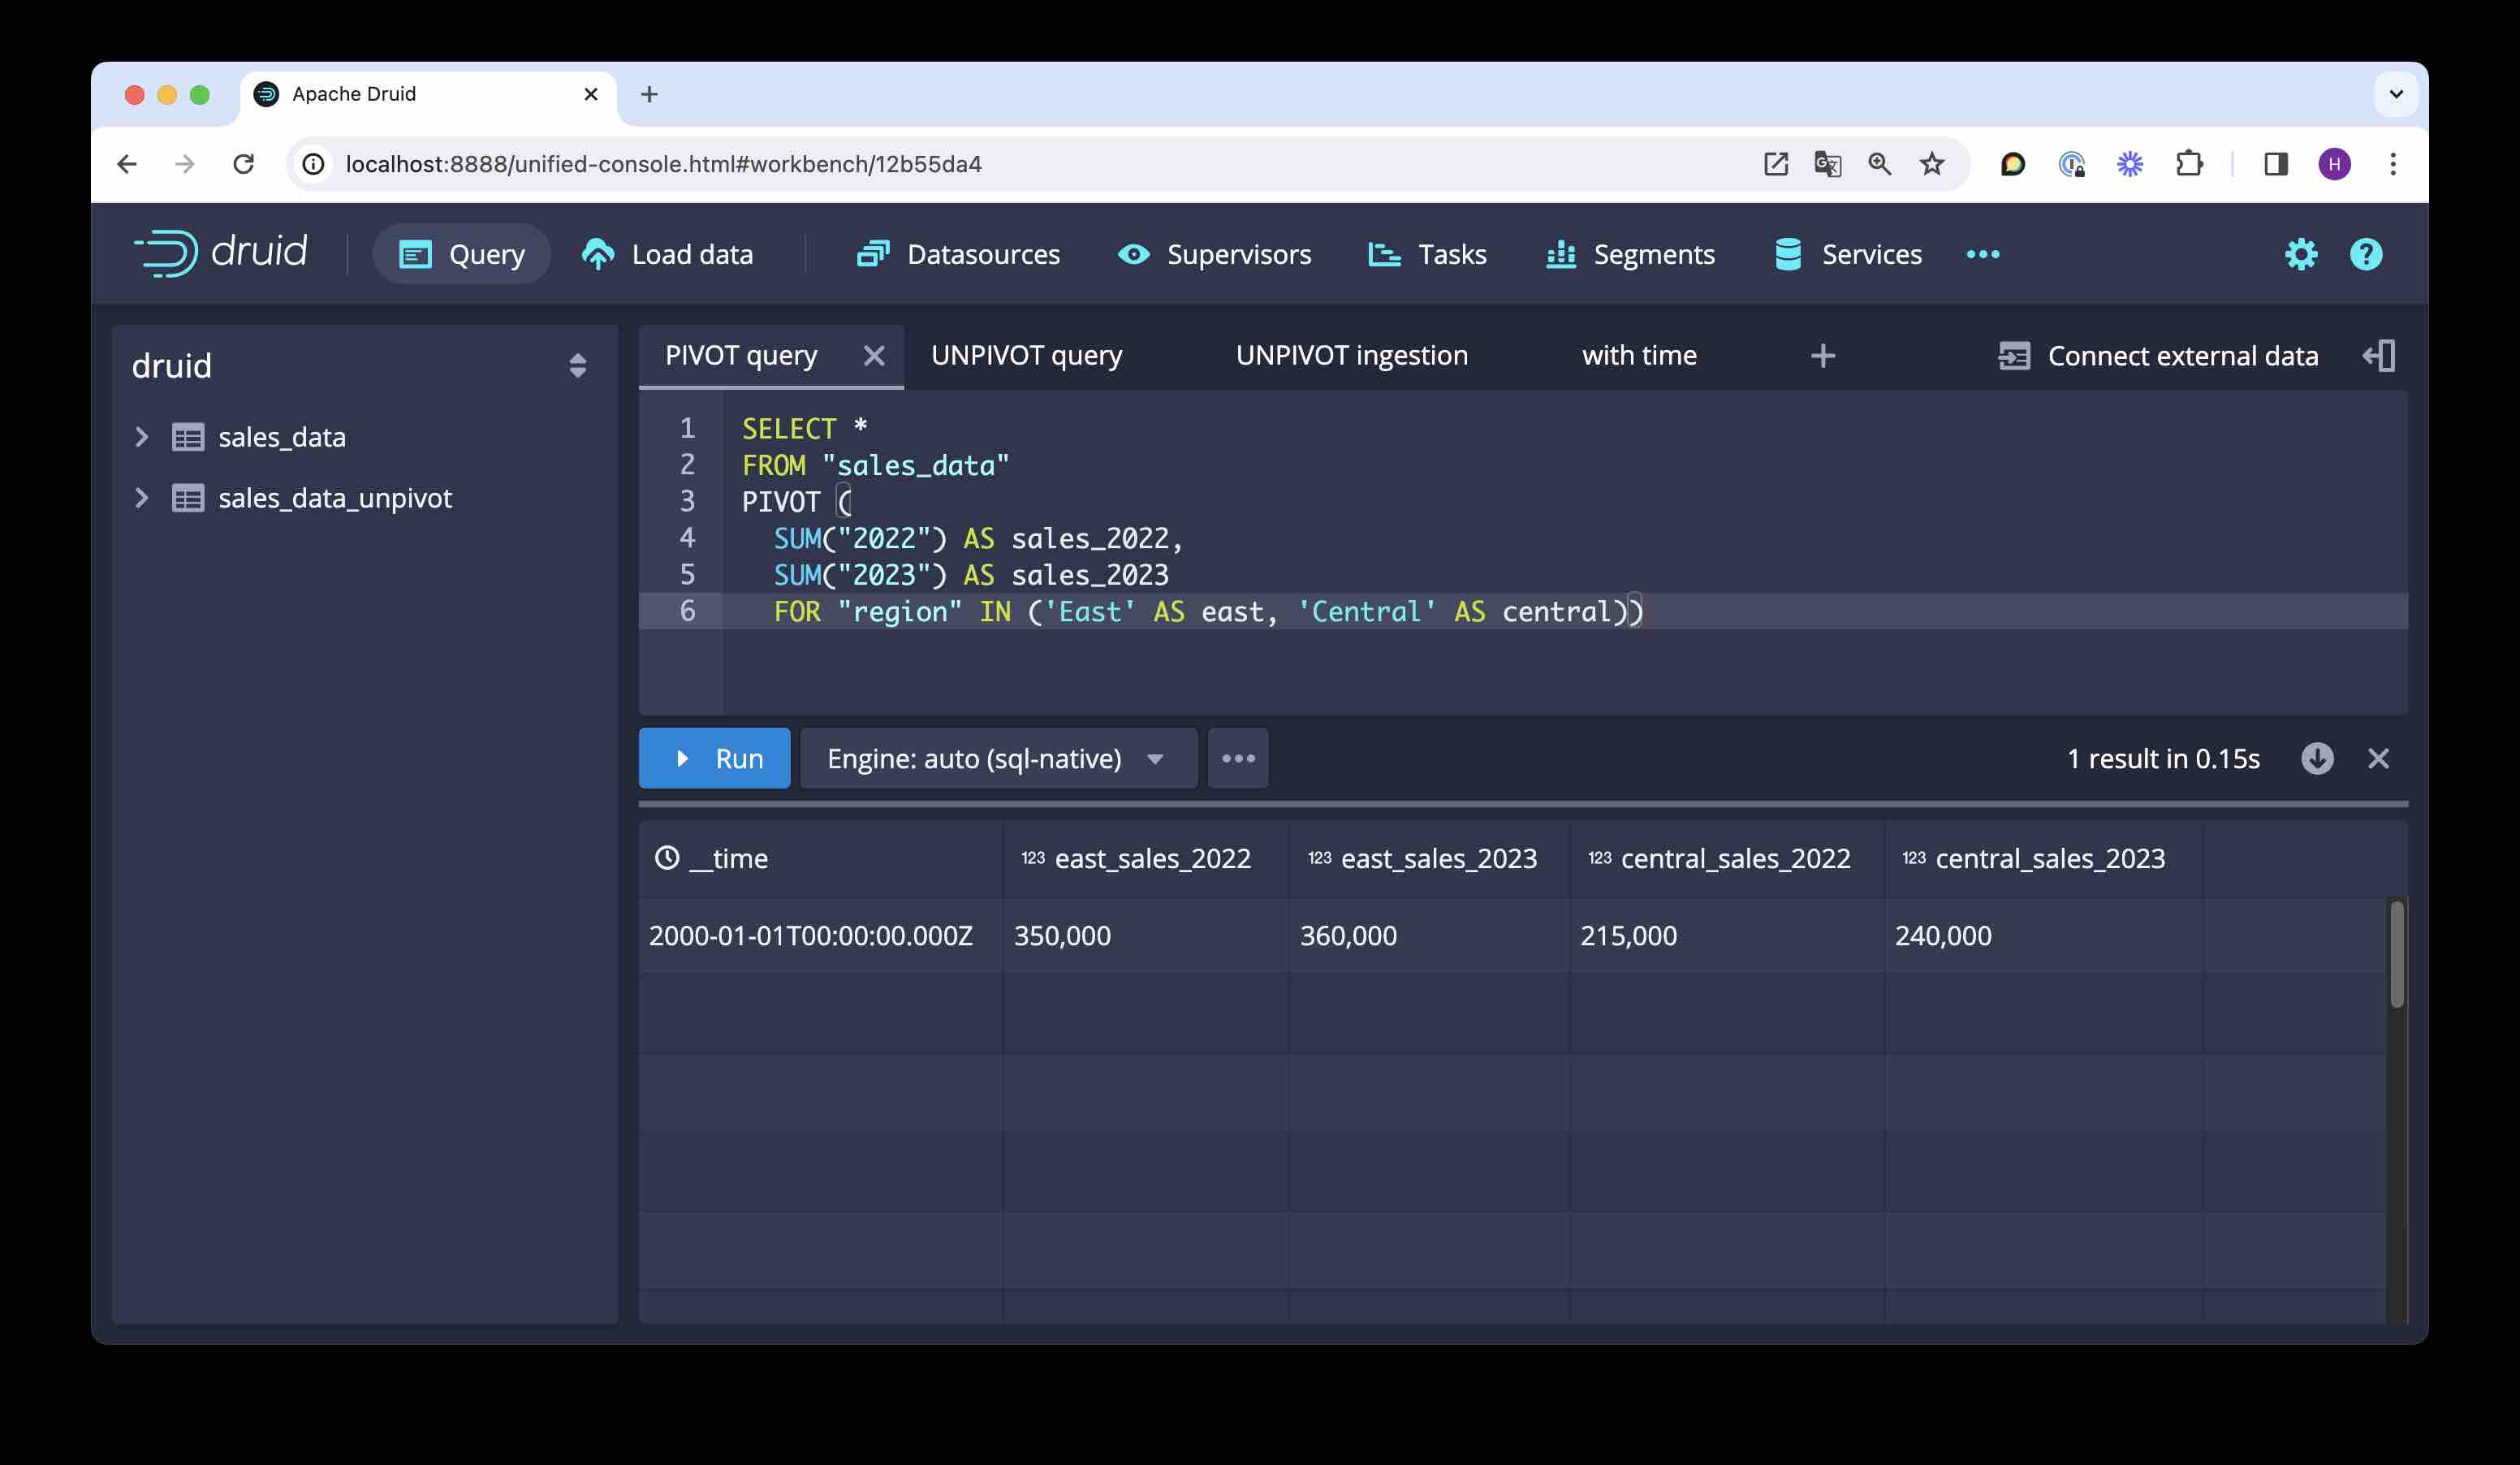
Let’s represent the data in a different form. We want one column per region and per year. Here is the query for this transformation:
SELECT *
FROM "sales_data"
PIVOT (
  SUM("2022") AS sales_2022,
  SUM("2023") AS sales_2023
  FOR "region" IN ('East' AS east, 'Central' AS central))
A few things worth noting:
PIVOTtakes a list of aggregations over existing value columns to calculate the values in the final columns.- The aggregations are needed because
PIVOTimplicitly groups by the values in the value columns. - The
FORclause lists the pivot column. - To keep the column list finite, you have to give it a list of values to filter by (like an implicit
HAVINGclause.) - You can define aliases for the values, those will serve as column prefixes.
- You can use the generated column names in query clauses - this here is a legitimate query:
SELECT east_sales_2022
FROM "sales_data"
PIVOT (
  SUM("2022") AS sales_2022,
  SUM("2023") AS sales_2023
  FOR "region" IN ('East' AS east, 'Central' AS central))
UNPIVOT - transpose columns to rows
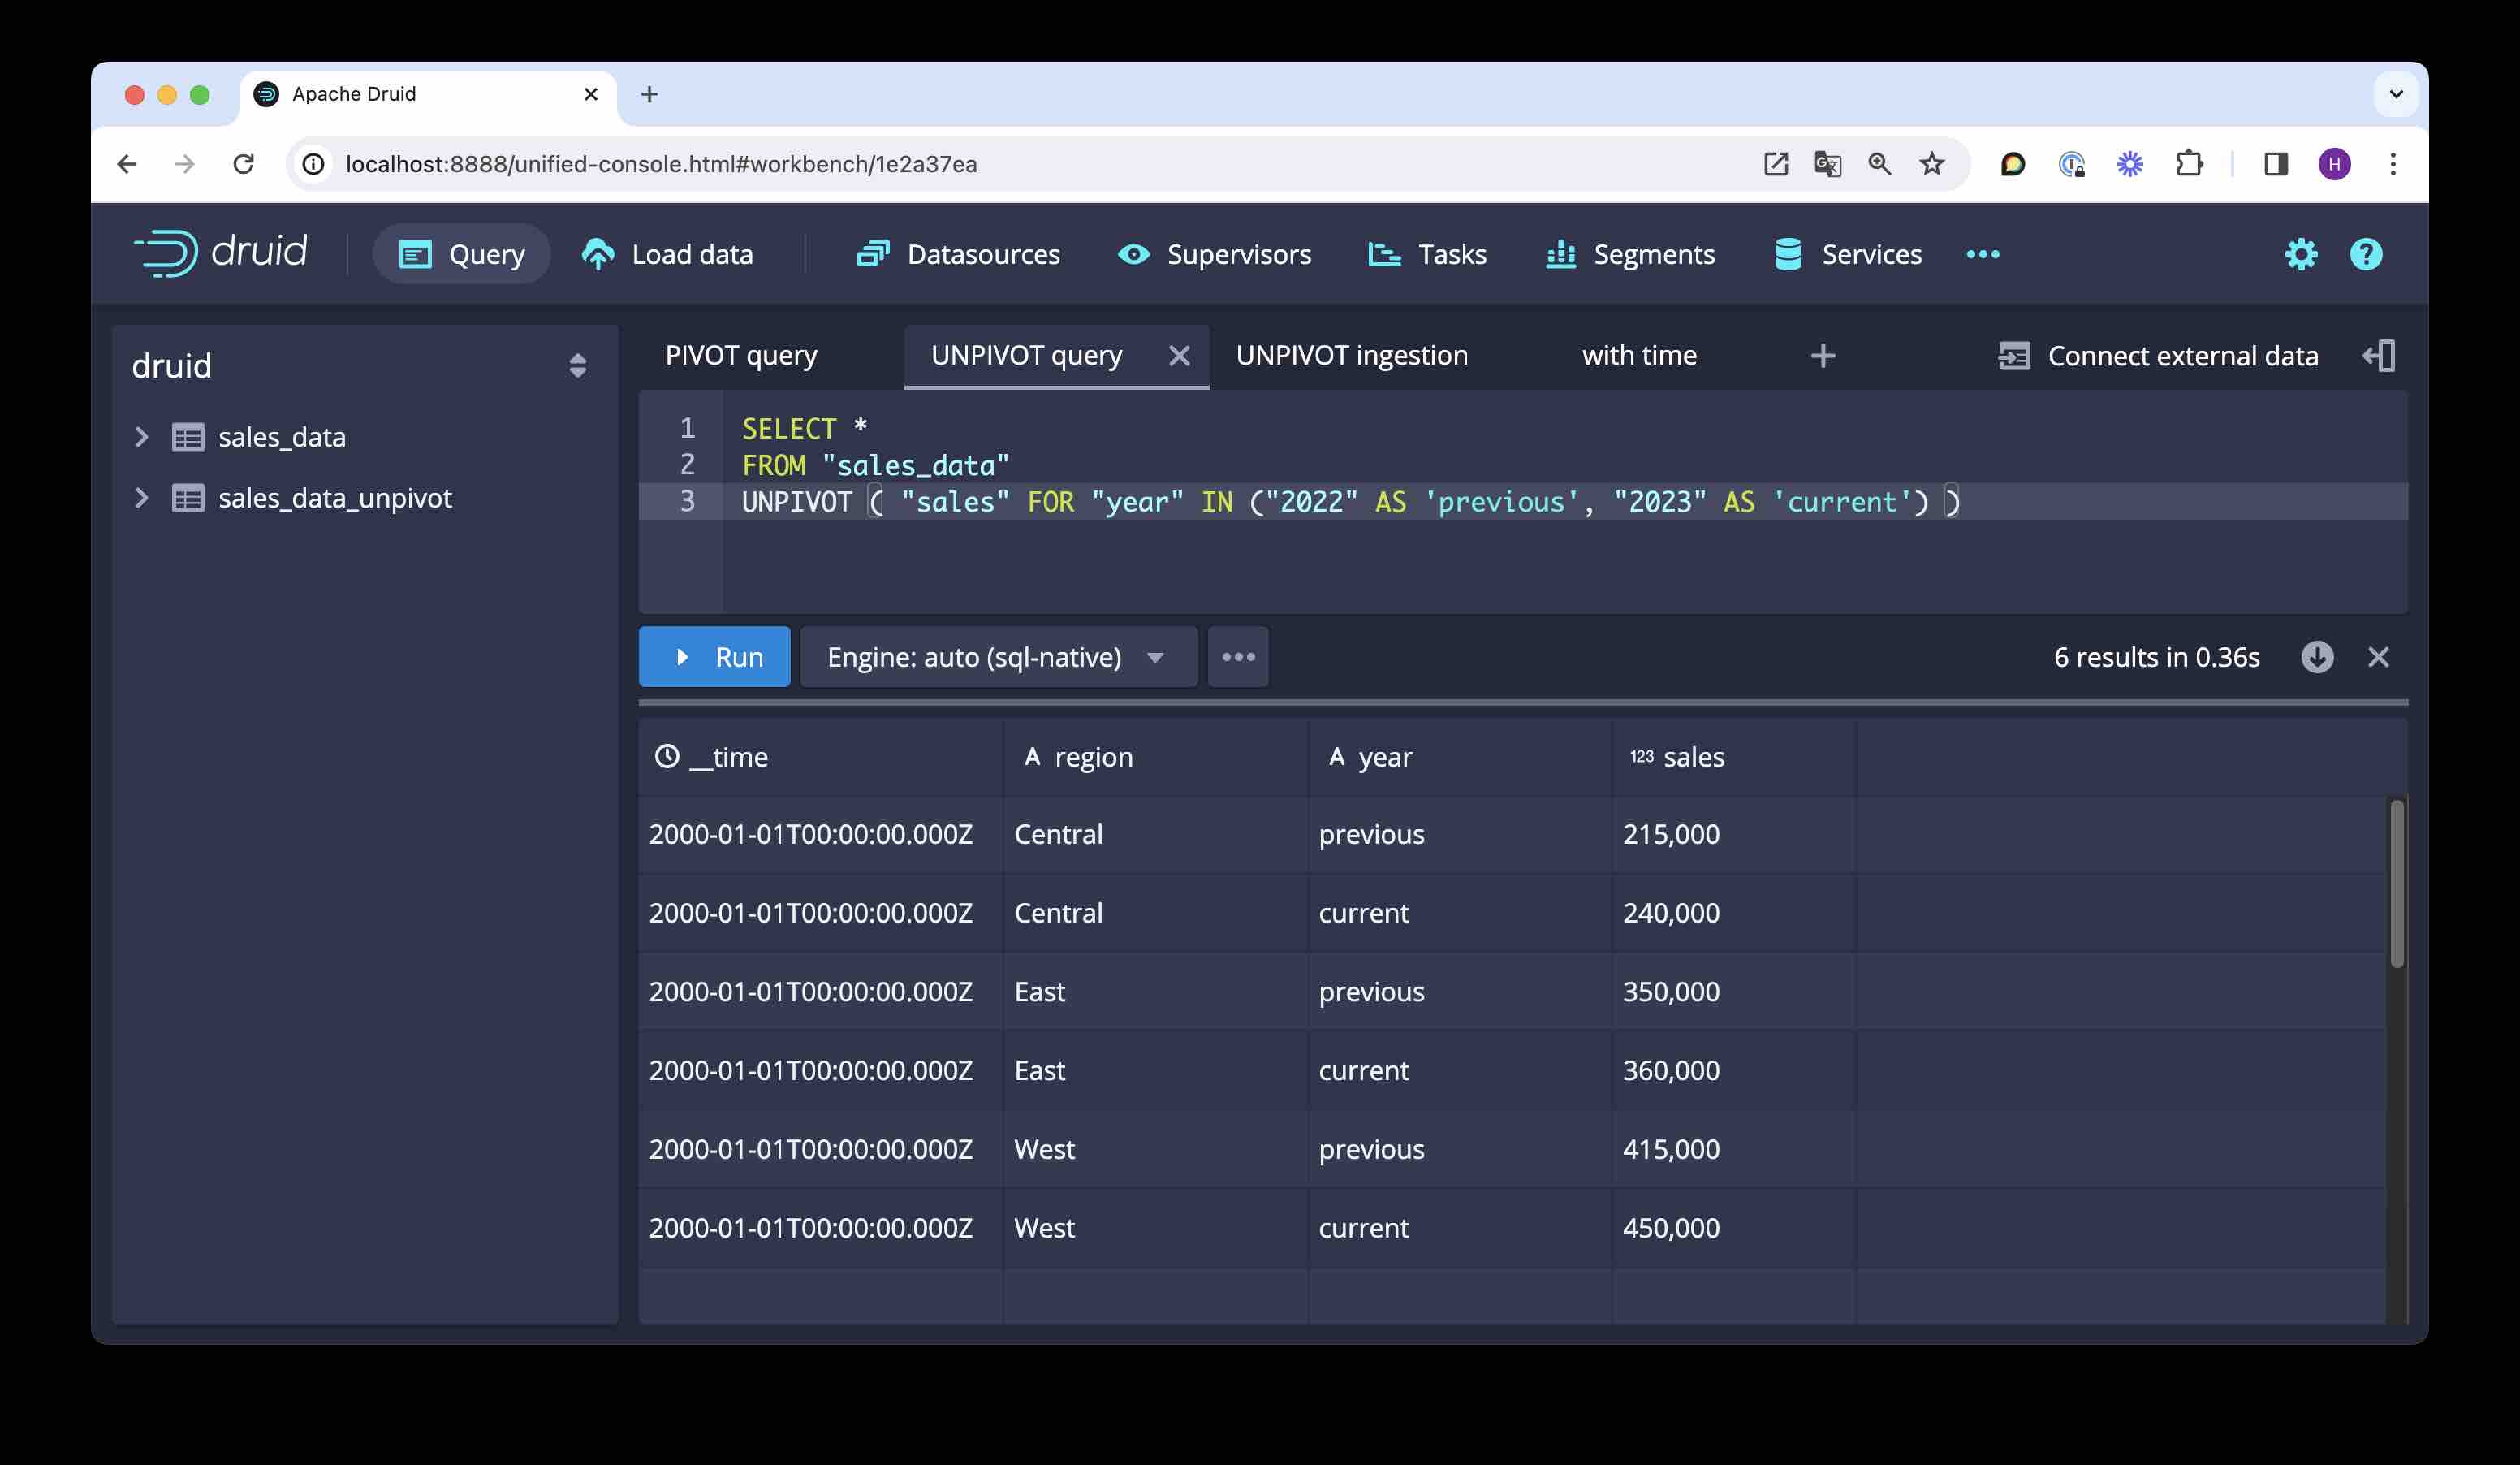
To collect a list of columns into one, transposing the columns to rows, you can use UNPIVOT. Here is a query that creates a format that you would probably prefer for further analytical processing:
SELECT *
FROM "sales_data"
UNPIVOT ( "sales" FOR "year" IN ("2022" AS 'previous', "2023" AS 'current') )
- An
UNPIVOTquery needs no aggregation since it only reorders the values. - You need to define two aliases:
- the first one,
"sales"in the example, is the column where the values end up; - the second one,
"year"is where the column names are collected, expressed as strings.
- the first one,
- Again, you can also define alias values for the column names.
UNPIVOT during ingestion
Back to the beginning of the story. As you may have noticed, the original table does not have a proper timestamp because the time information is in the column headers. Instead we just let Druid fill in a constant dummy timestamp. This is not optimal, particularly since the input data is very obviously time based!
Can we use our new knowledge to generate a proper timestamp?
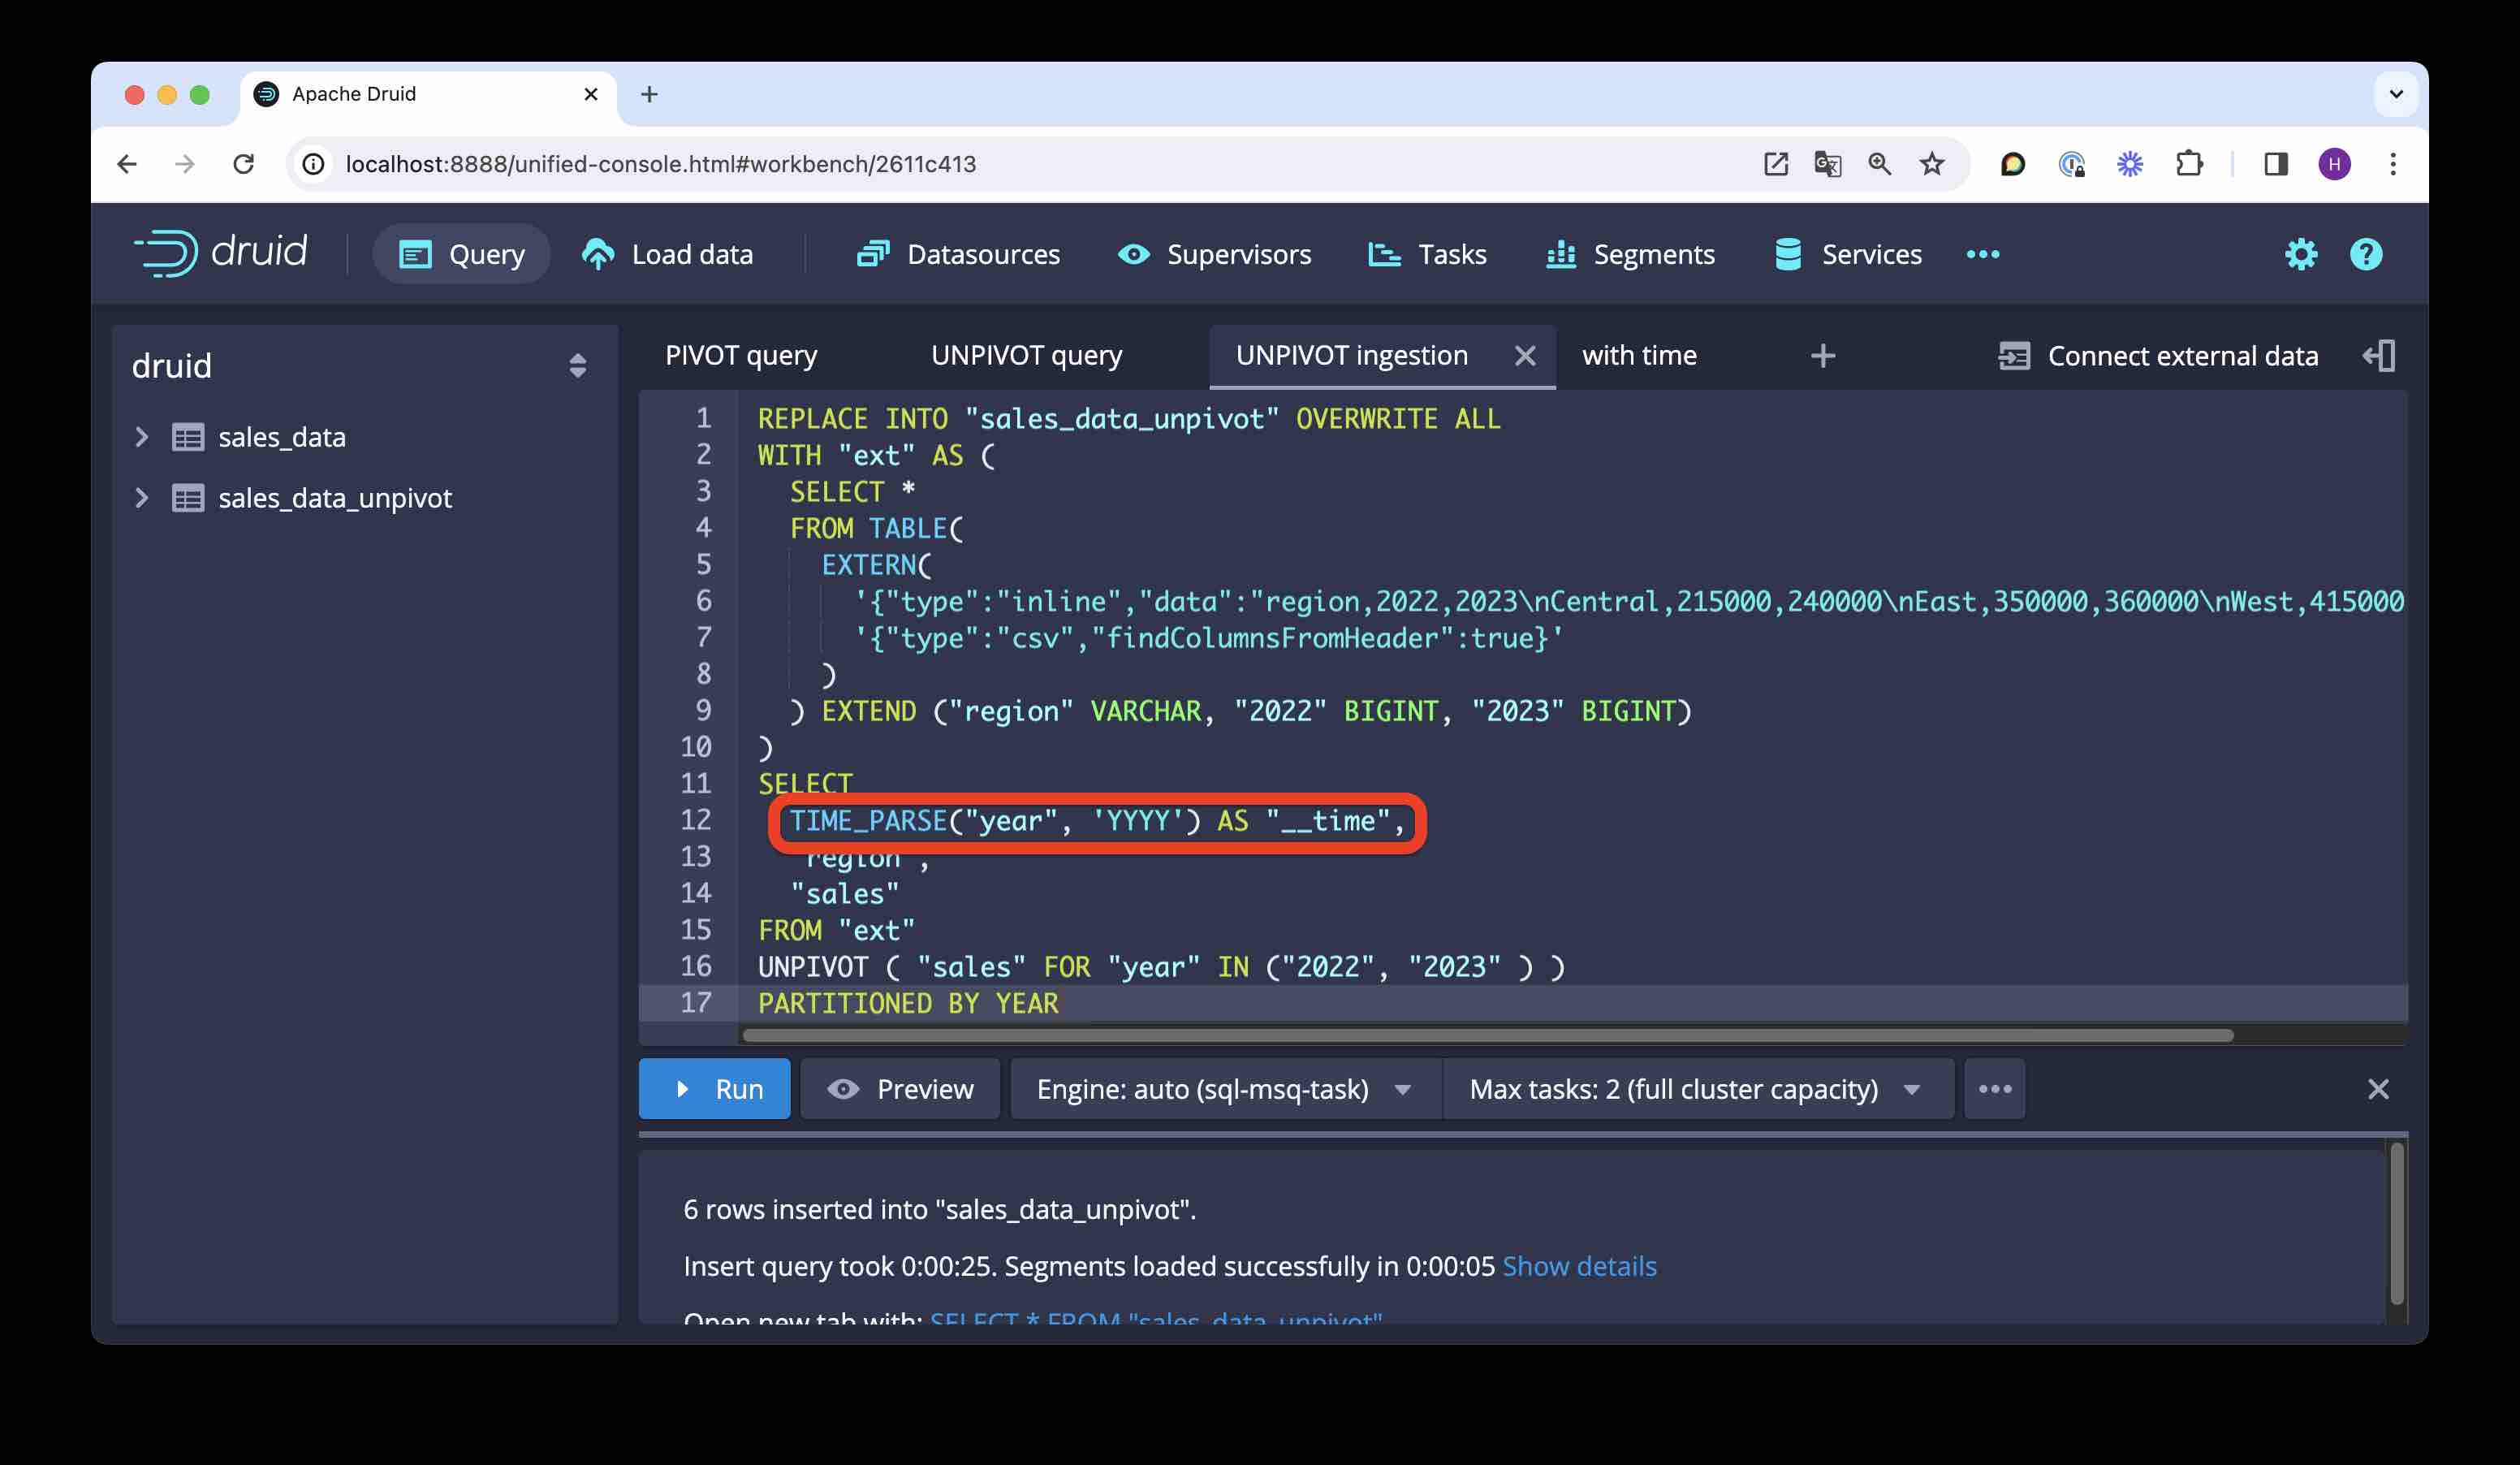
Let’s see how to do this using SQL based ingestion. We’ll generate the timestamp column by UNPIVOTing the year column headers into a single new column, and parsing that column as a timestamp:
REPLACE INTO "sales_data_unpivot" OVERWRITE ALL
WITH "ext" AS (
  SELECT *
  FROM TABLE(
    EXTERN(
      '{"type":"inline","data":"region,2022,2023\nCentral,215000,240000\nEast,350000,360000\nWest,415000,450000"}',
      '{"type":"csv","findColumnsFromHeader":true}'
    )
  ) EXTEND ("region" VARCHAR, "2022" BIGINT, "2023" BIGINT)
)
SELECT
  TIME_PARSE("year", 'YYYY') AS "__time",
  "region",
  "sales"
FROM "ext"
UNPIVOT ( "sales" FOR "year" IN ("2022", "2023" ) )
PARTITIONED BY YEAR
Let’s check the result:
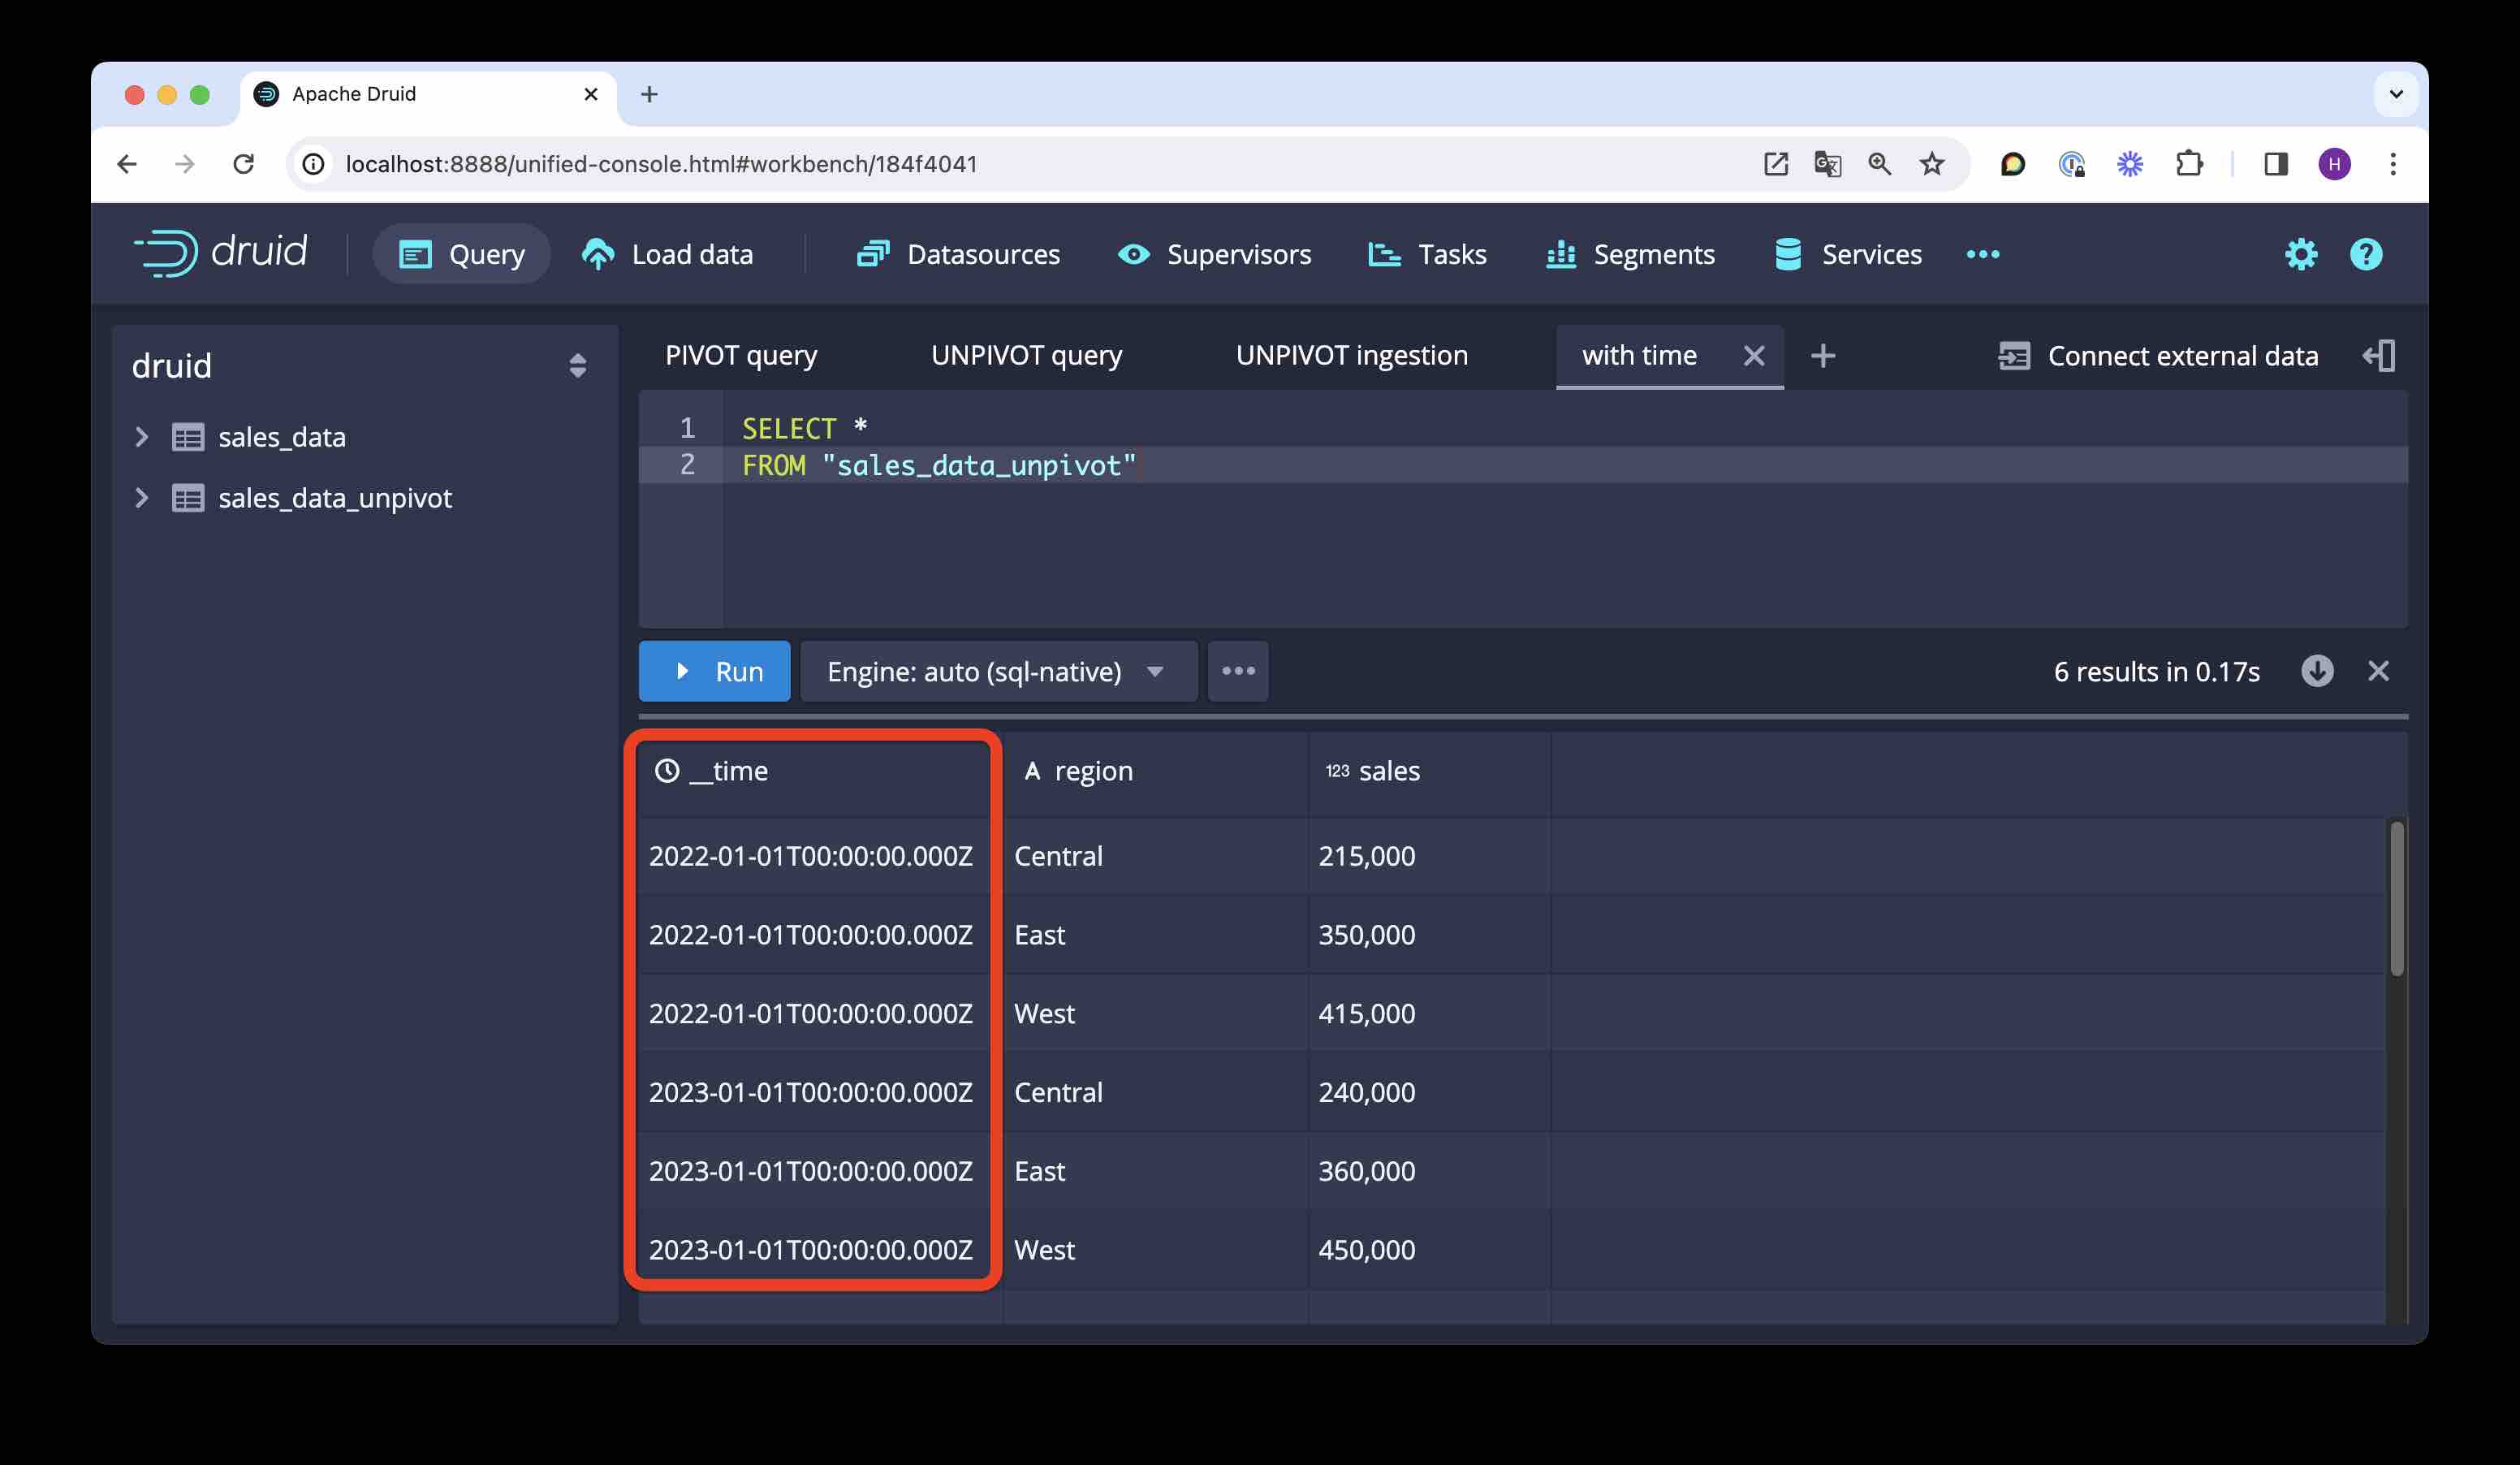
We have a proper timestamp. (You can also check the Segments view to verify that the data is actually partitioned by year.)
Conclusion
PIVOTtransposes rows to columns, aggregating values on the way.UNPIVOTtransposes columns to rows.- The behavior of both functions can be fine tuned by choosing suitable column aliases.
- One case where this is especially handy is with spreadsheet data that has the time axis across.
“This image is taken from Page 500 of Praktisches Kochbuch für die gewöhnliche und feinere Küche” by Medical Heritage Library, Inc. is licensed under CC BY-NC-SA 2.0 ![]()
![]()
![]()
![]() .
.