Street Level Maps in Imply Pivot with Flight Data and Confluent Cloud
Imply Pivot has had map visualizations for a while. But the builtin map outline was limited to mostly by-country resolution (with ISO codes), or to the grid points defined by geohashes. Consequently, the map overlay was static and the maximum resolution limited.
With Imply Private and Hybrid, you can use fine grained maps now the display data points by their exact longitude/latitude coordinates. The maps are provided by MapBox and are zoomable to the individual street level. Let’s see how street level maps work with Imply Pivot in the quickstart version.
In this tutorial, you will:
- set up Pivot for street level maps with your own MapBox token to use MapBox overlays
- connect to a data source with ADS-B flight data using Confluent Cloud
- ingest a data set with flight data
- configure your Pivot cube to use longitude and latitude data
- and configure a visualization, exploring some of the options.
The tutorial works with the Imply 2023.01 quickstart.
Prerequisites
Obtaining a Mapbox API Token
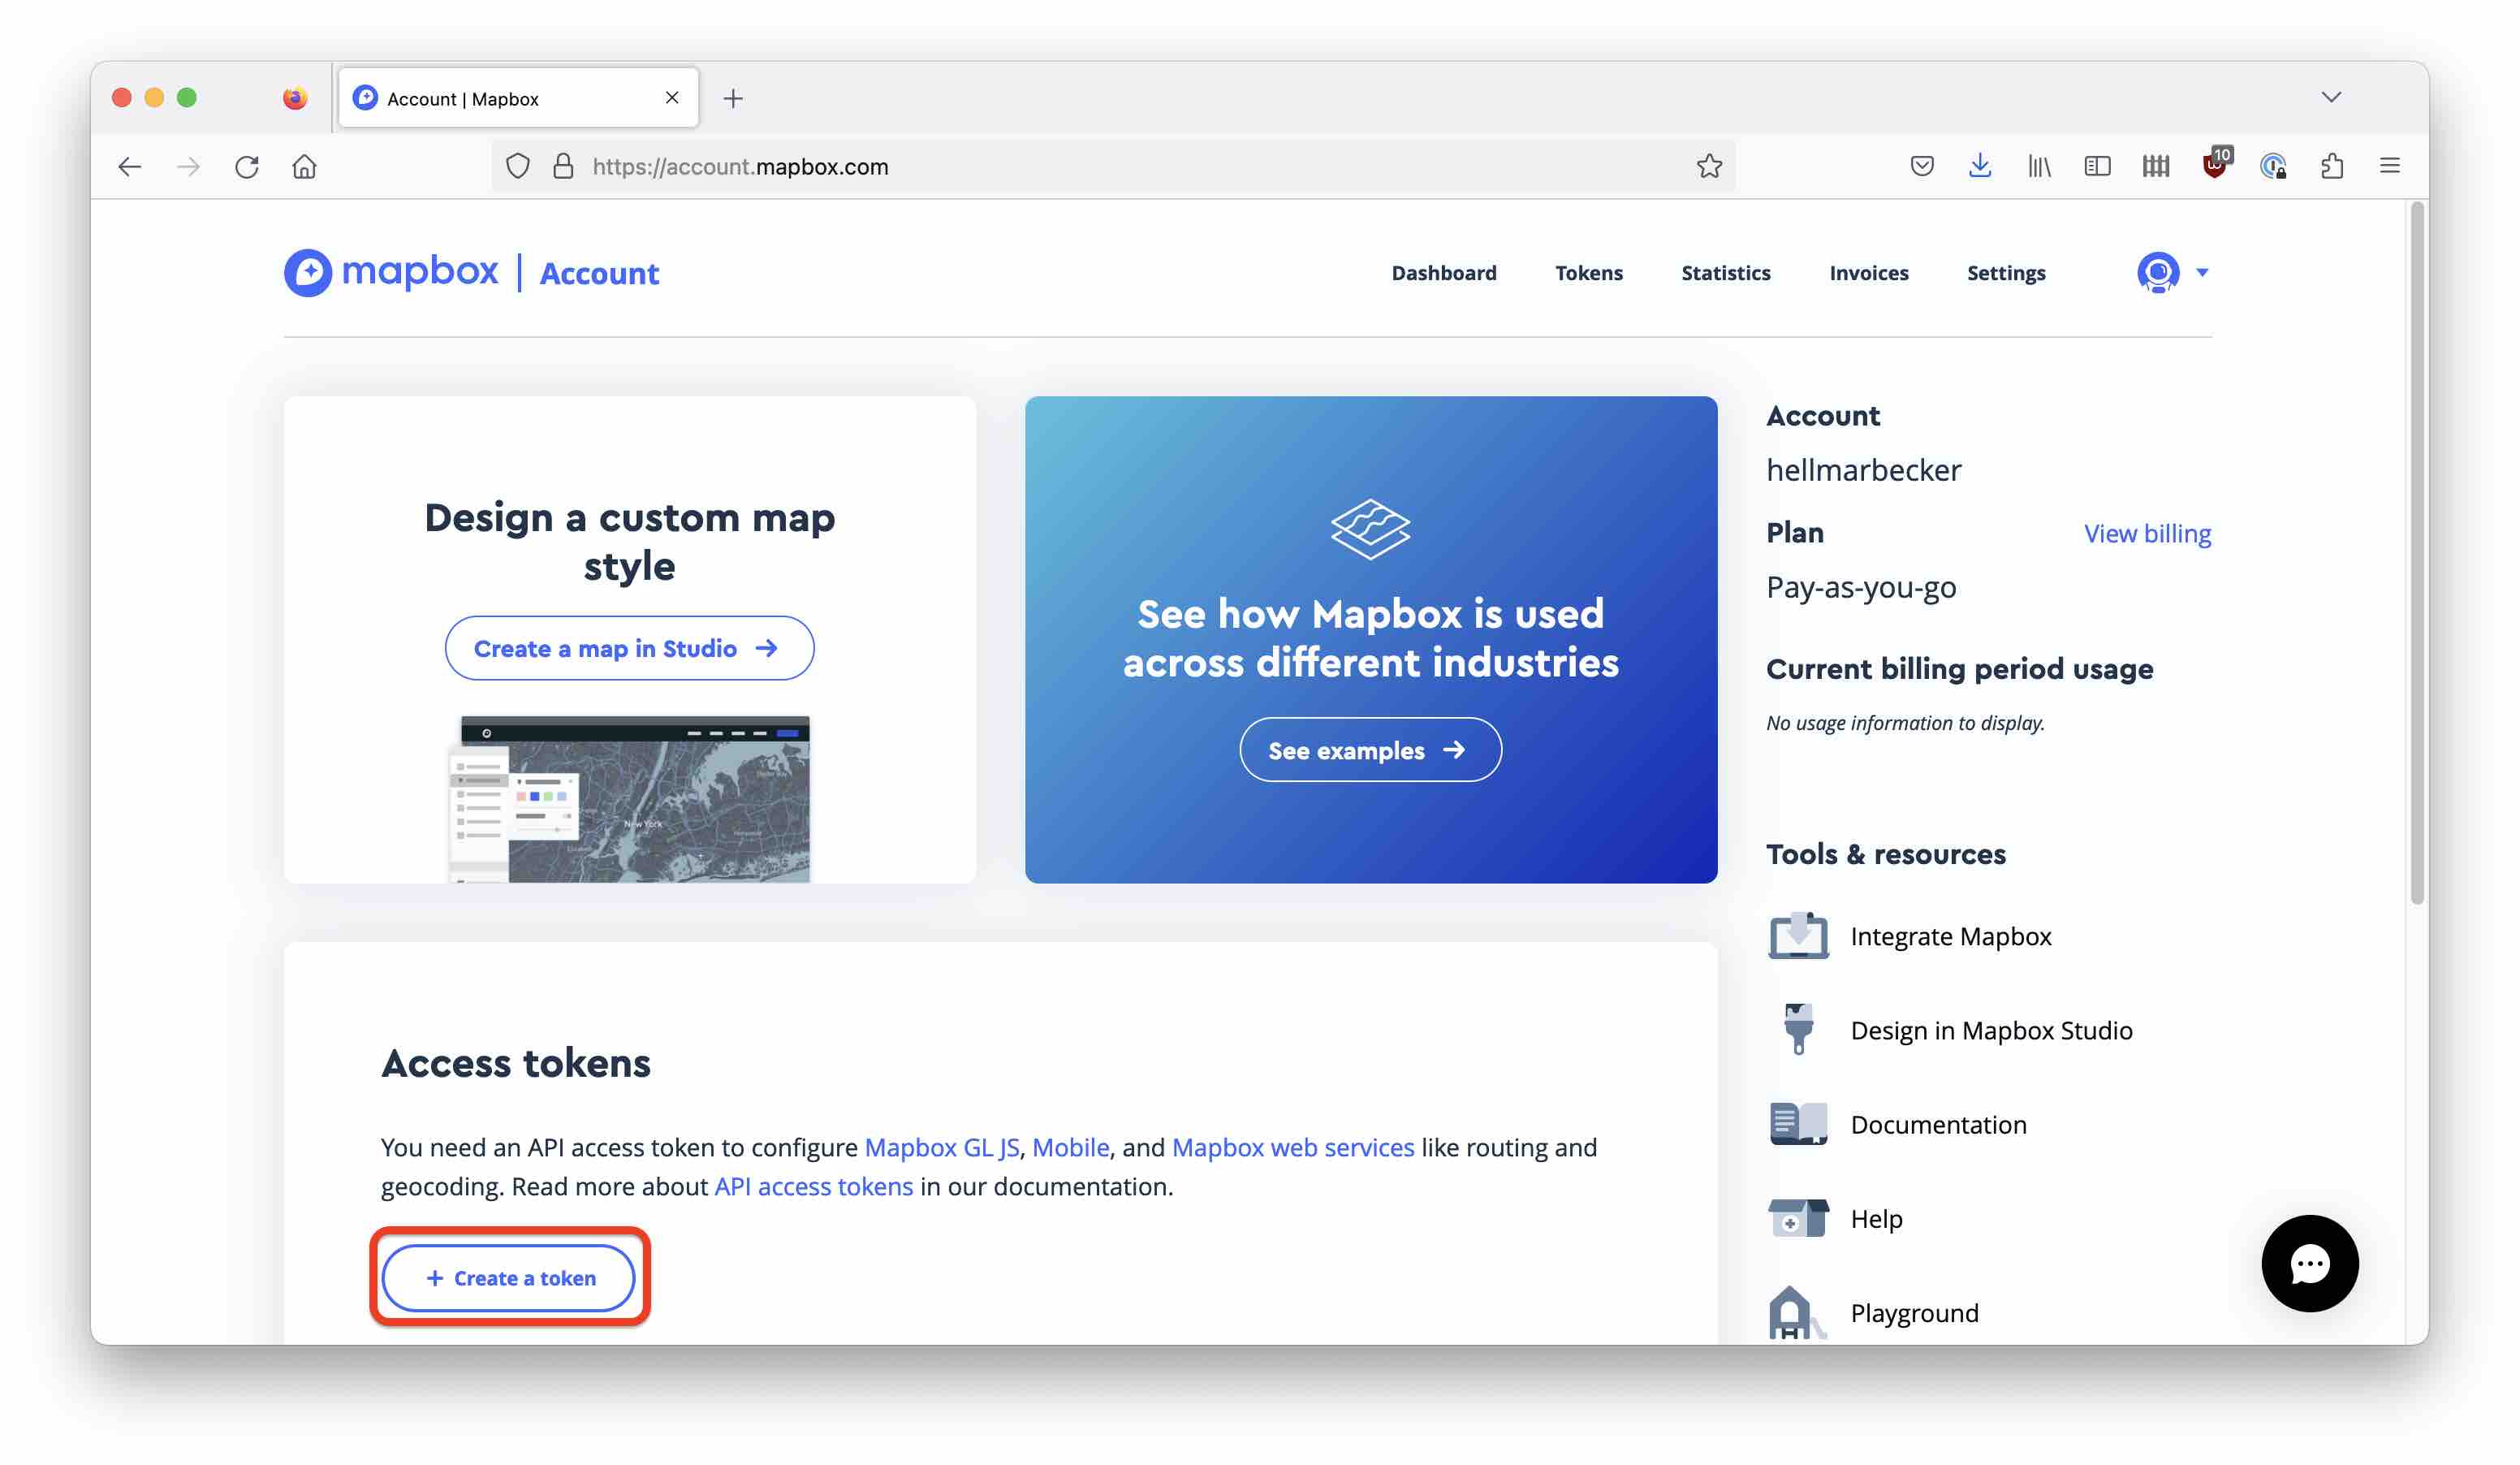
Create a free account on the MapBox website. MapBox has a free tier that is sufficient for this tutorial. Navigate to your account page and click the Create a token button:
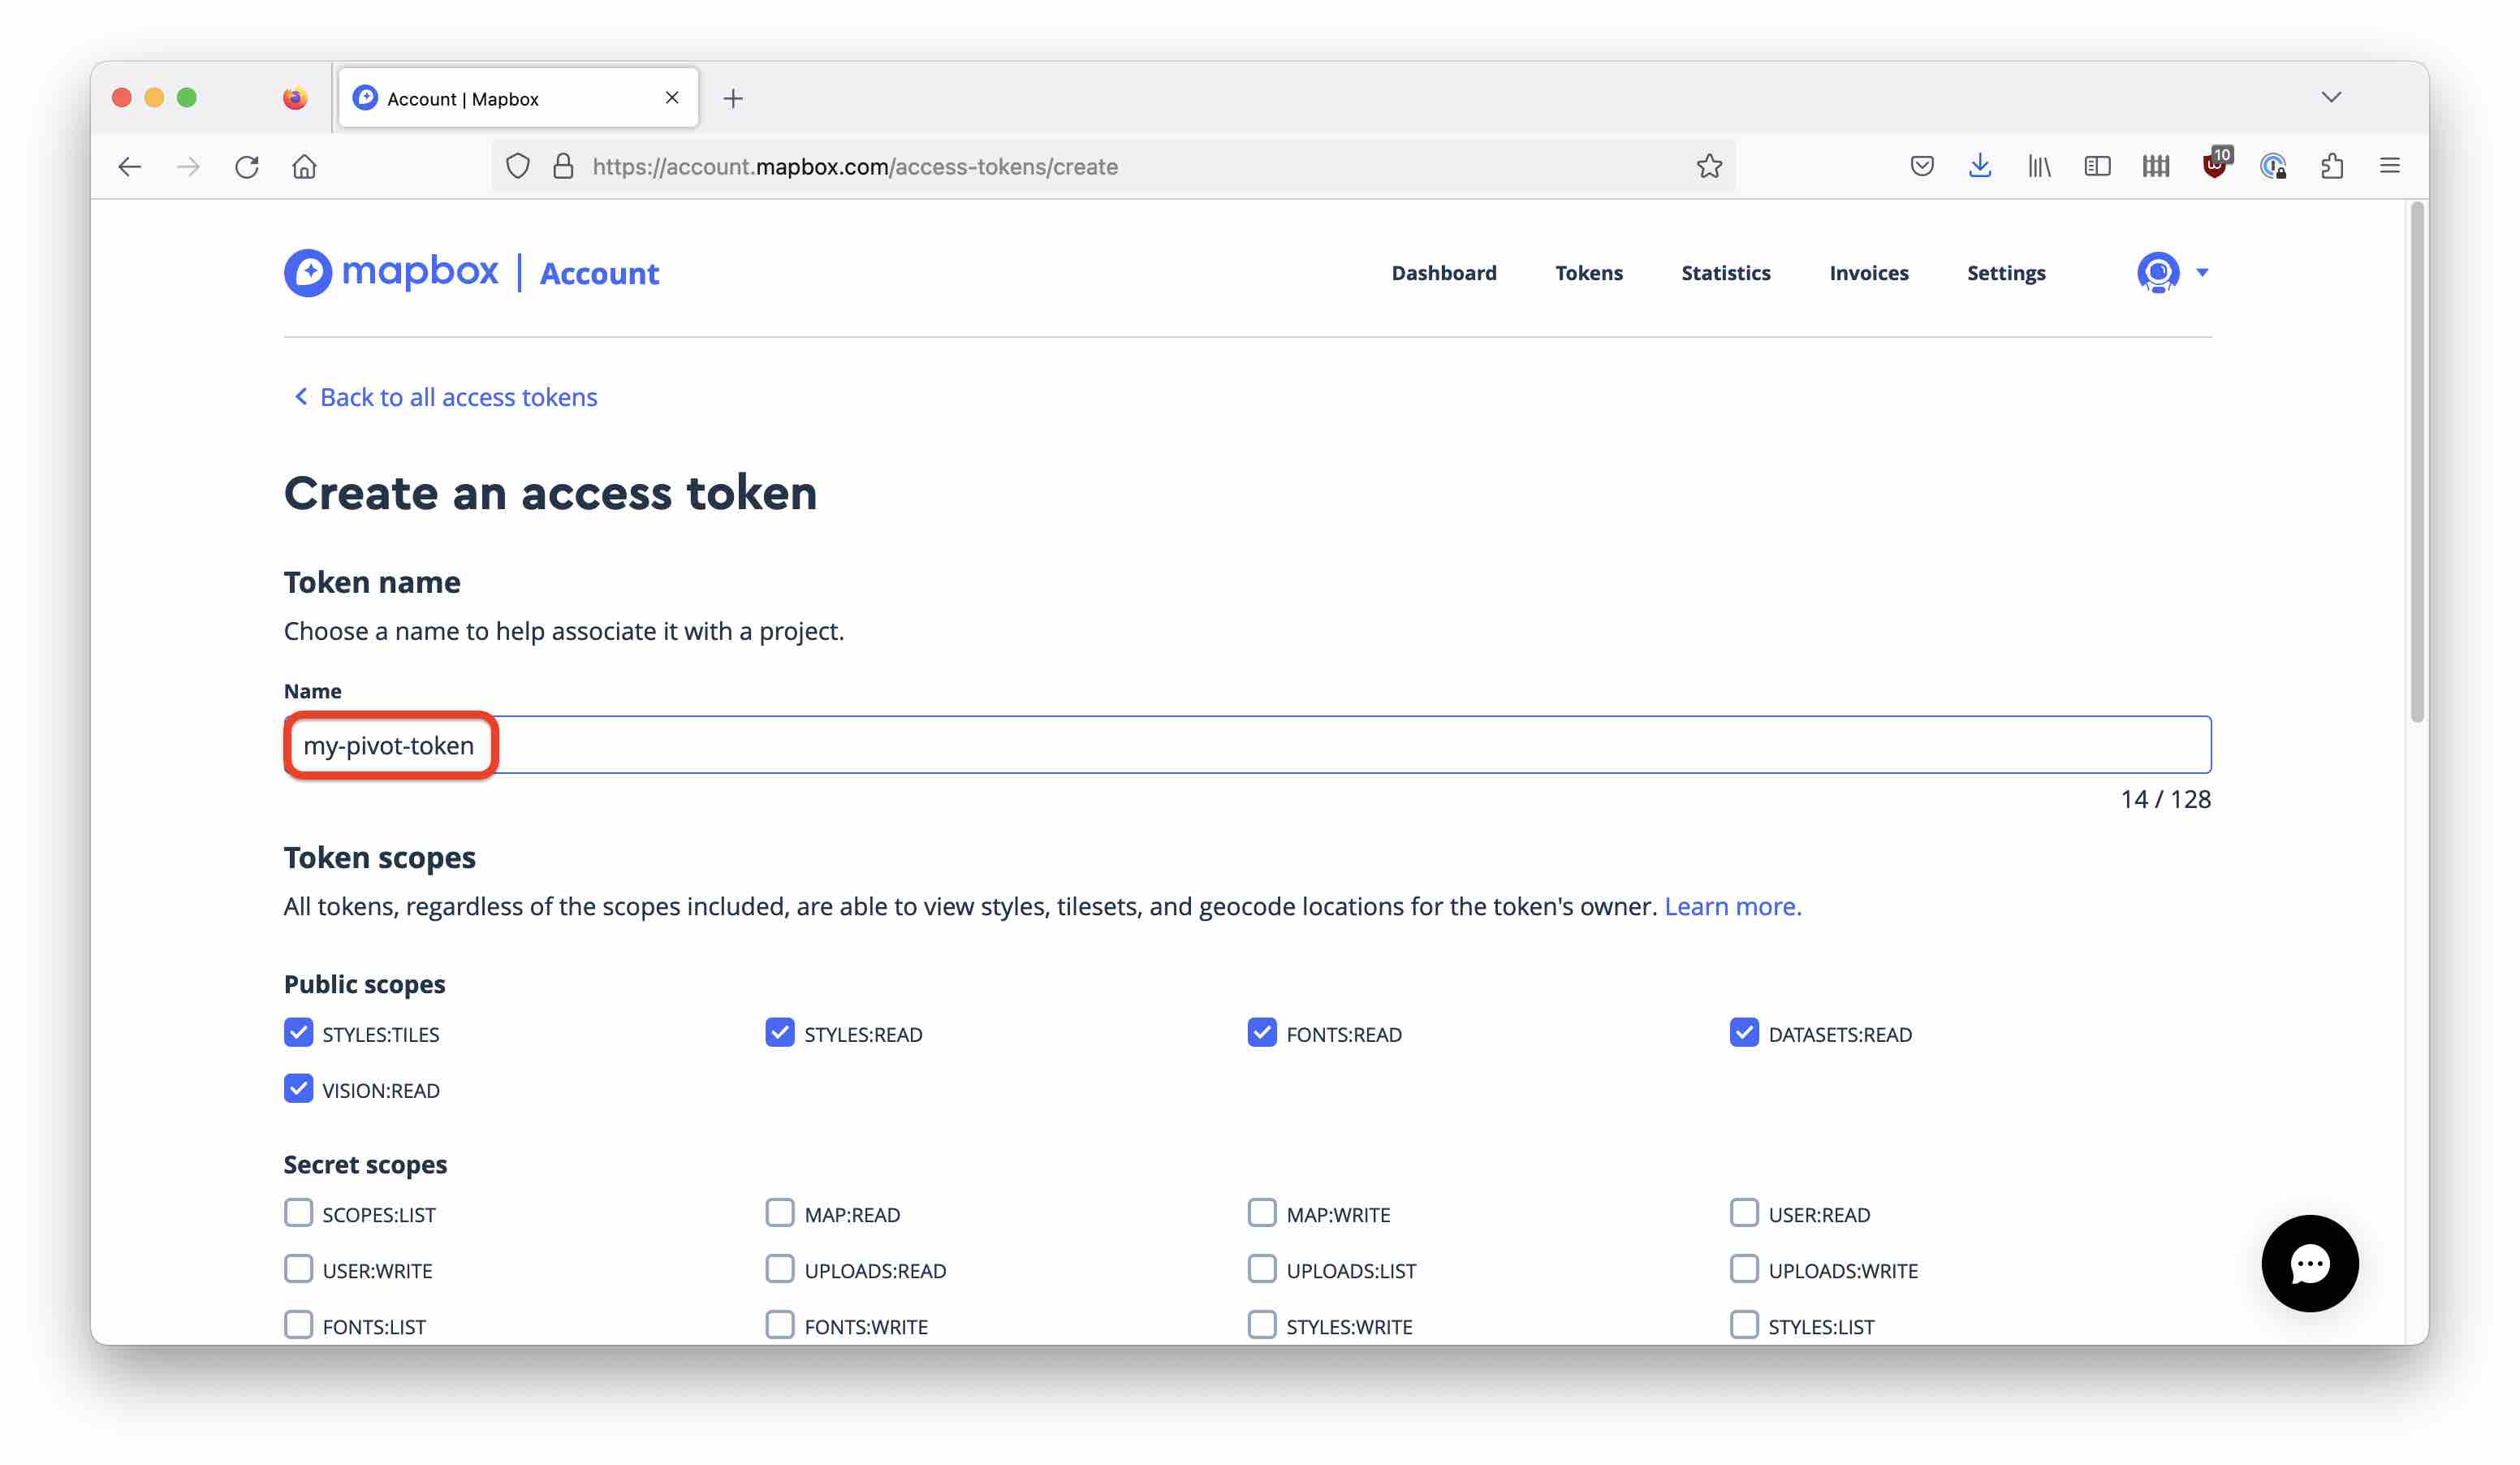
This takes you to the token creation page. Enter a name for your key and do not change any of the default options. In particular, do not select any of the options under Secret scopes. Selecting any of those will create a secret key with a different prefix that Pivot cannot use.
Hit the Create token button
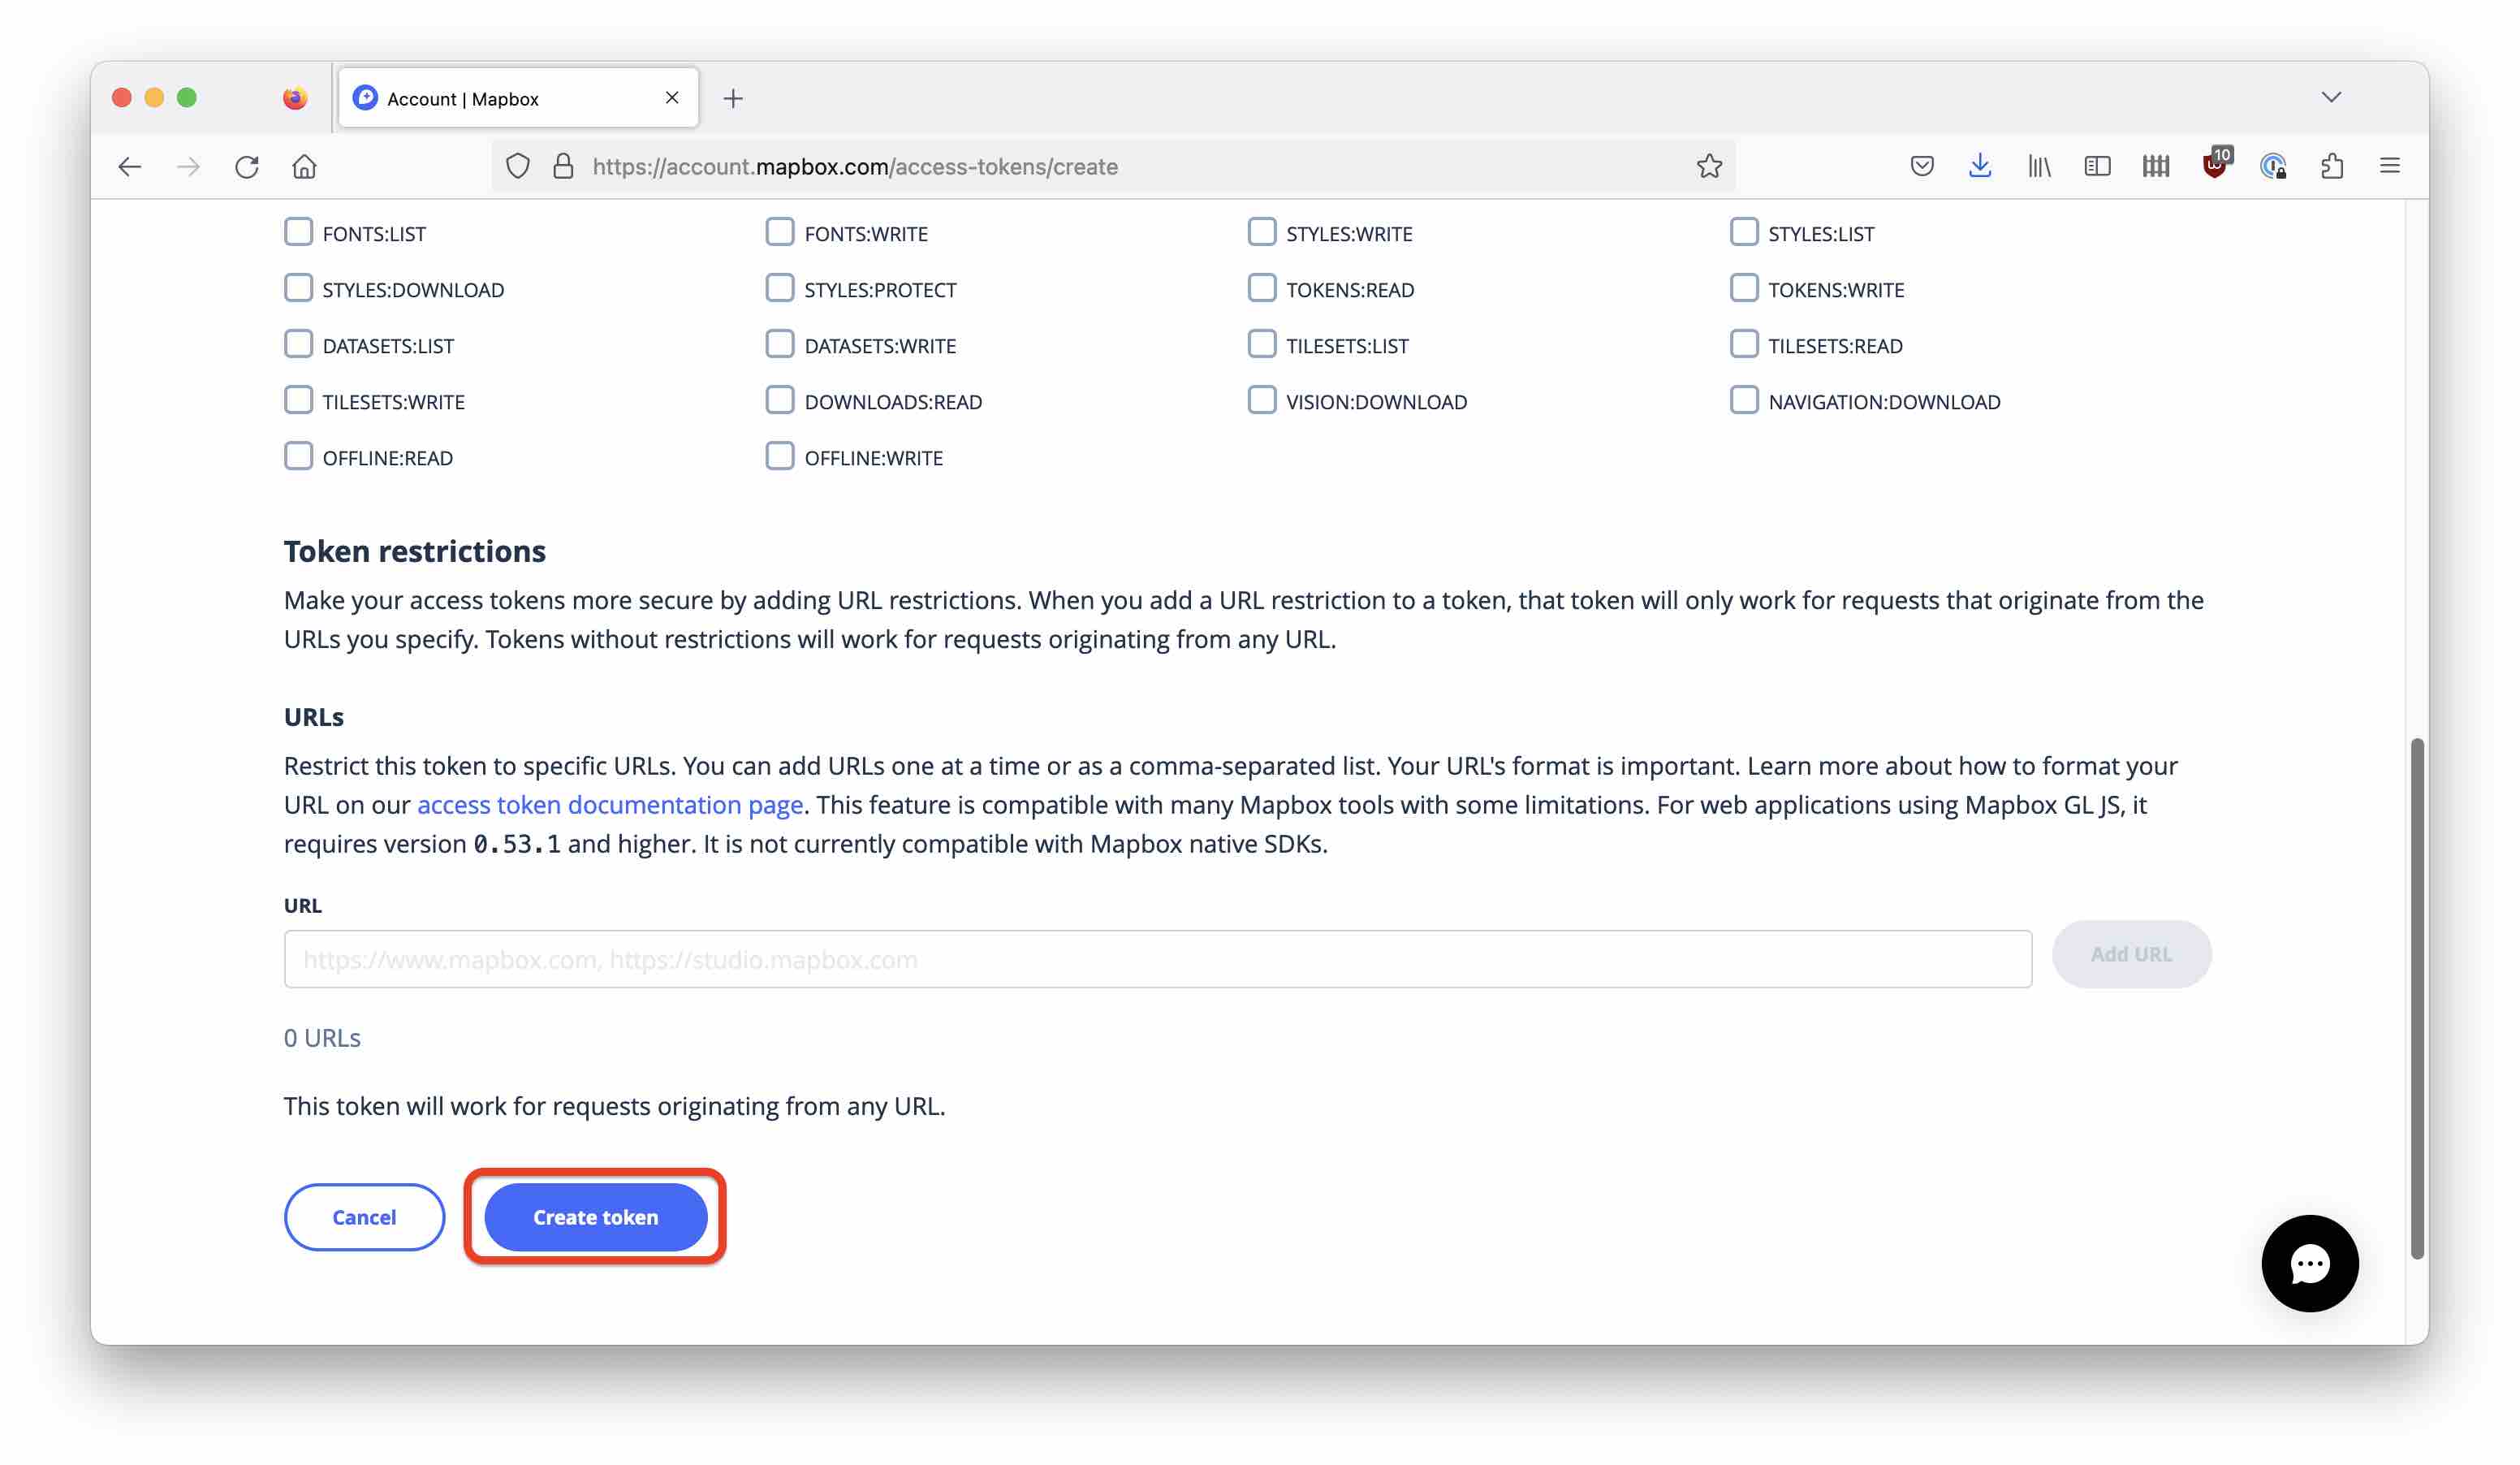
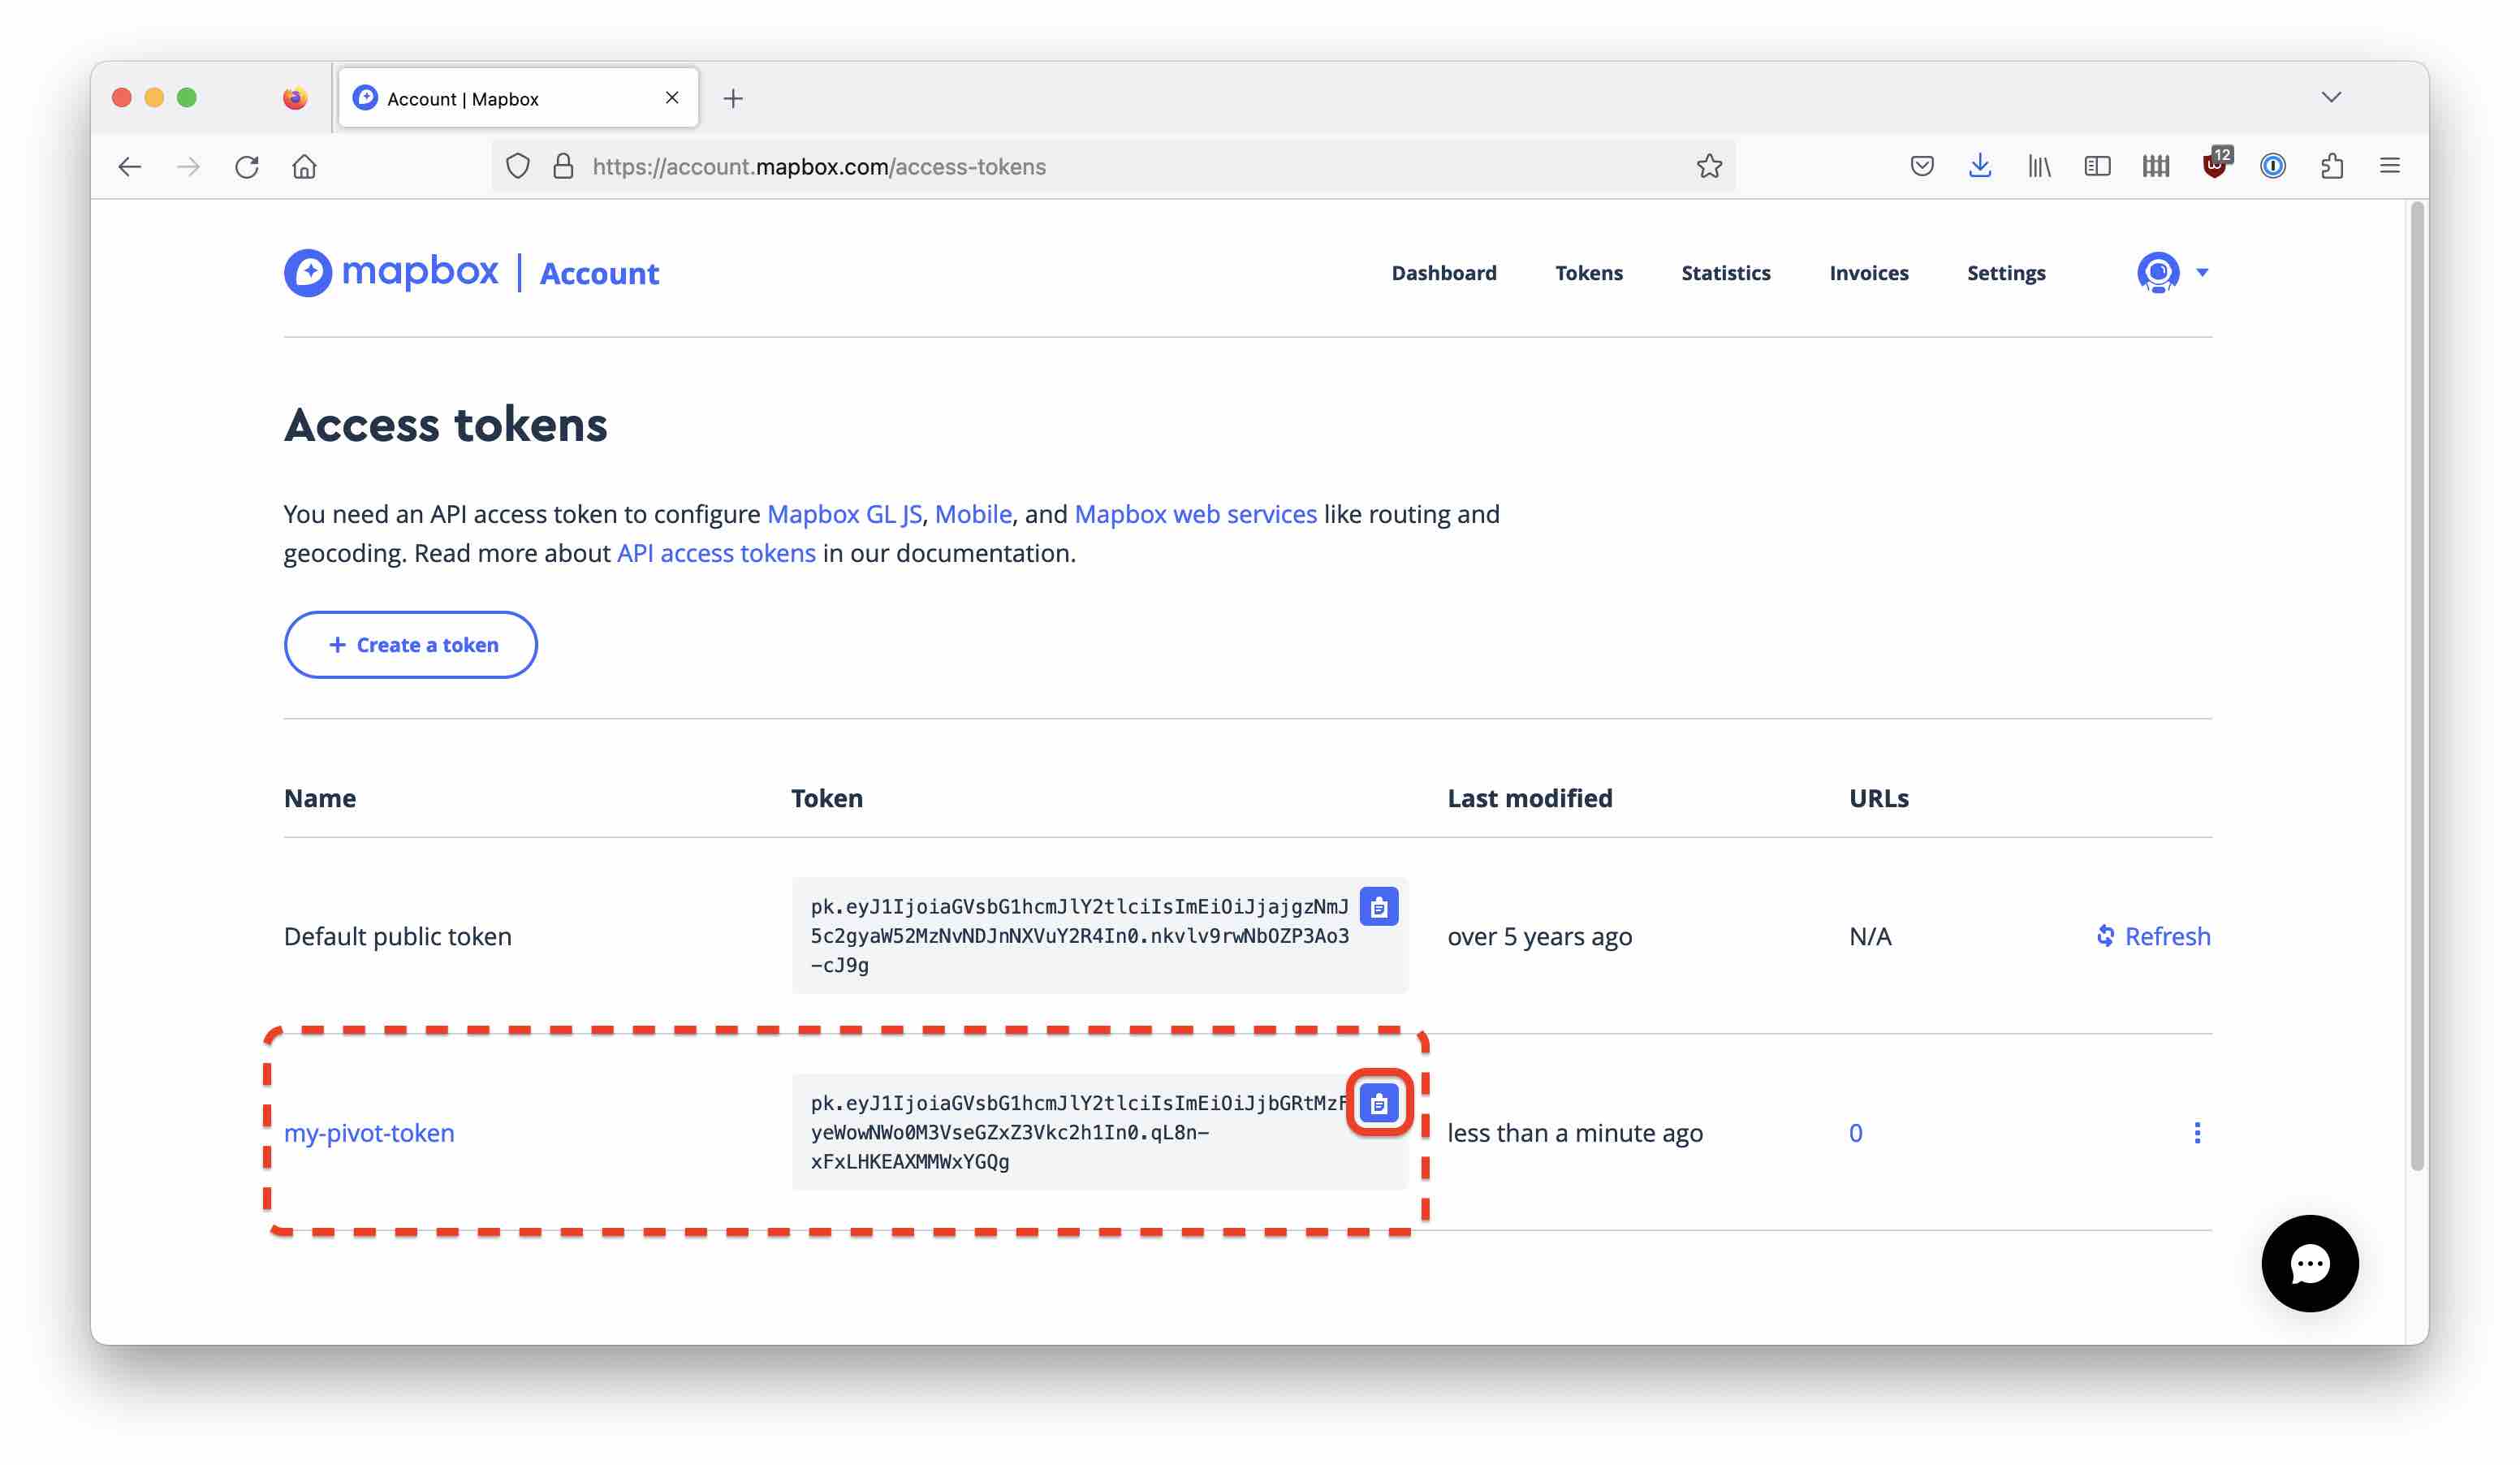
and you will be taken to the Tokens page.
Find your token and click the clipboard icon to copy the token string:
Configuring the Pivot Instance
Before you start up Imply, you have to enter the MapBox token into the Pivot configuration file. After you untar the Imply distribution, edit the file conf-quickstart/pivot/config.yaml and add the following lines to the end:
mapboxConfig:
  token: <your mapbox token>
replacing the token placeholder with the token string you just copied. Save the configuration file.
Enabling the Feature Flag
Start Imply:
bin/supervise -c conf/supervise/quickstart.conf
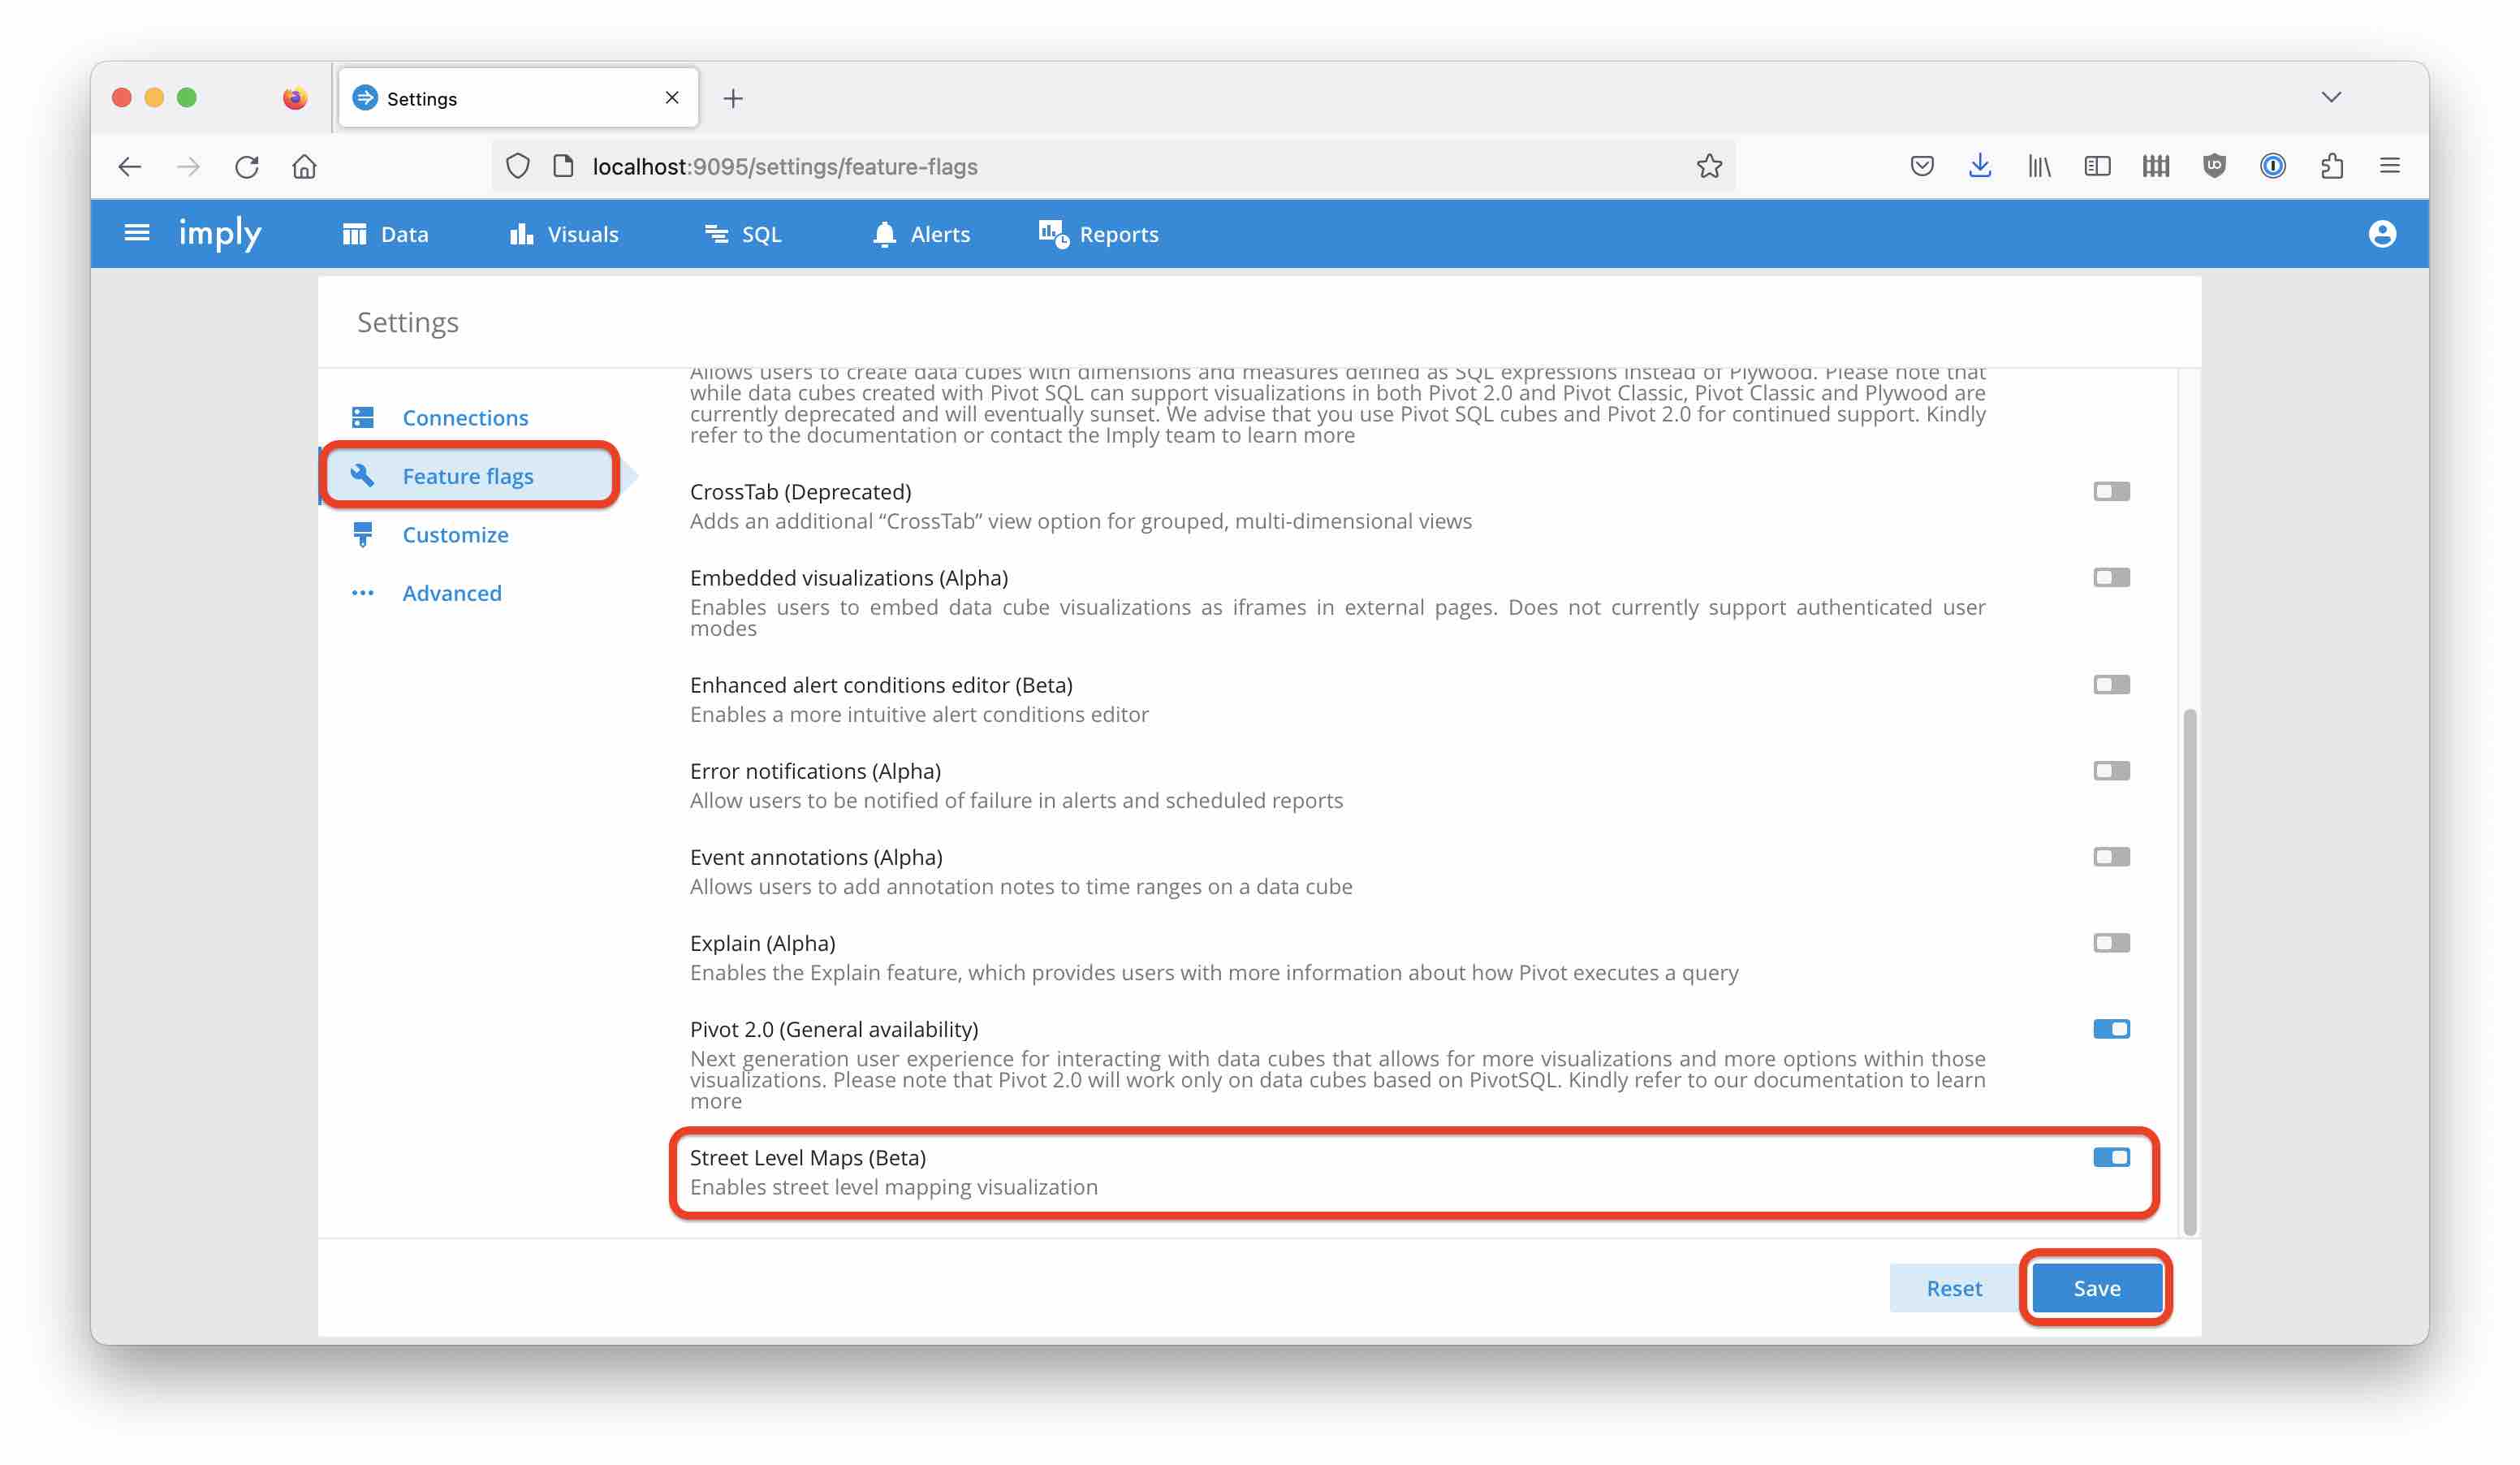
and navigate your browser to localhost:9095 to access Pivot. Open the Settings page
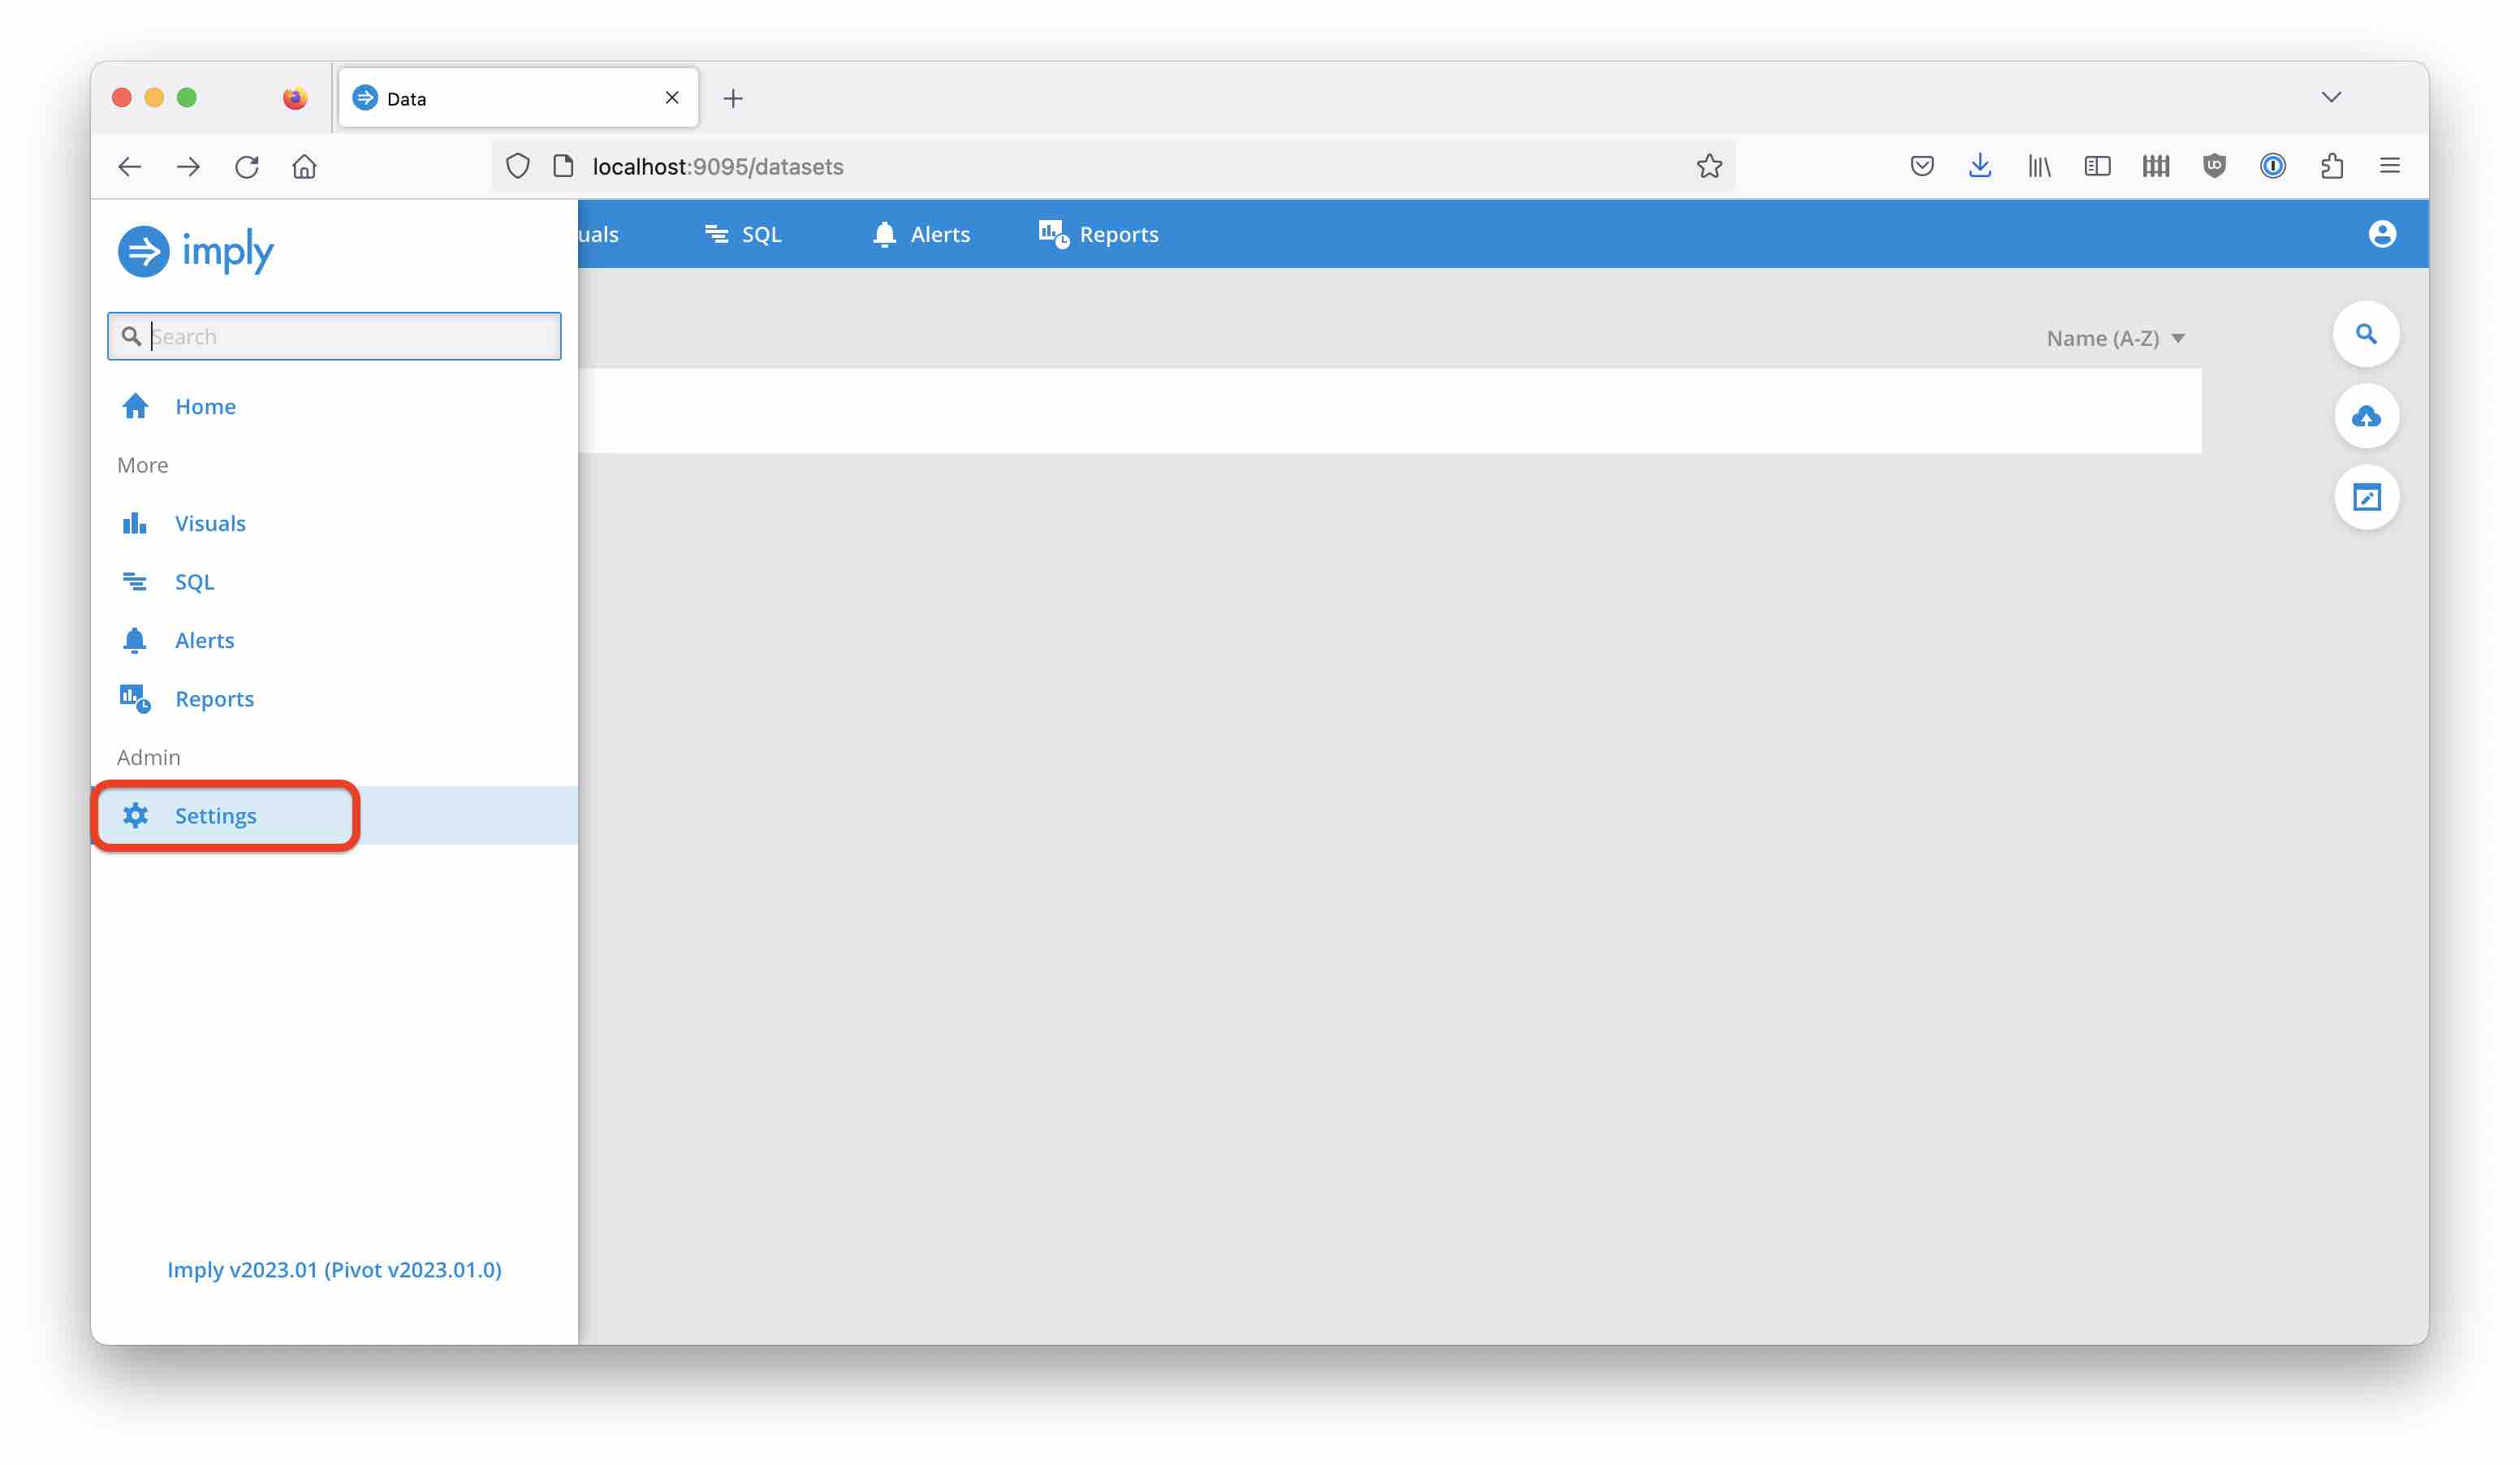
and select Feature flags. You will find the flag for street level maps at the very bottom. Toggle the flag and save the settings:
The Data
Data Generation
The data source for this tutorial is an ADS-B receiver that decodes transponder data from aircraft that fly over my house.
A sample of the data looks like this:
MSG,1,333,1981,3C66AB,2081,2023/01/04,07:03:59.481,2023/01/04,07:03:59.481,DLH9AL,,,,,,,,,,,
MSG,5,333,1981,3C66AB,2081,2023/01/04,07:03:59.481,2023/01/04,07:03:59.481,,35725,,,,,,,0,,0,0
MSG,3,333,1981,3C66AB,2081,2023/01/04,07:03:59.482,2023/01/04,07:03:59.482,,35750,,,48.58890,11.25838,,,0,0,0,0
MSG,4,333,1981,3C66AB,2081,2023/01/04,07:03:59.537,2023/01/04,07:03:59.537,,,378.0,354.1,,,-1088,,,,,
MSG,5,333,1981,3C66AB,2081,2023/01/04,07:03:59.538,2023/01/04,07:03:59.538,,35725,,,,,,,0,,0,0
MSG,4,333,1984,3C644C,2084,2023/01/04,07:03:59.540,2023/01/04,07:03:59.540,,,372.0,244.6,,,1472,,,,,
MSG,5,333,1984,3C644C,2084,2023/01/04,07:03:59.540,2023/01/04,07:03:59.540,,17925,,,,,,,0,,0,0
MSG,5,333,1984,3C644C,2084,2023/01/04,07:03:59.542,2023/01/04,07:03:59.542,,17925,,,,,,,0,,0,0
MSG,4,333,1985,4841A8,2085,2023/01/04,07:03:59.693,2023/01/04,07:03:59.693,,,468.0,145.1,,,-1024,,,,,
MSG,4,333,1984,3C644C,2084,2023/01/04,07:03:59.913,2023/01/04,07:03:59.913,,,370.0,244.6,,,1472,,,,,
MSG,3,333,1985,4841A8,2085,2023/01/04,07:03:59.915,2023/01/04,07:03:59.915,,25200,,,48.20100,11.15014,,,0,0,0,0
MSG,5,333,1985,4841A8,2085,2023/01/04,07:04:00.187,2023/01/04,07:04:00.187,,25200,,,,,,,0,,0,0
My blog describes how to get these data into Confluent Cloud from your Raspberry Pi.
Data Ingestion
Ingest the data into Druid using this ingestion spec, replacing the placeholders with your own Confluent access data:
{
  "type": "kafka",
  "spec": {
    "ioConfig": {
      "type": "kafka",
      "consumerProperties": {
        "bootstrap.servers": "<CONFLUENT BOOTSTRAP SERVER>",
        "security.protocol": "SASL_SSL",
        "sasl.mechanism": "PLAIN",
        "sasl.jaas.config": "org.apache.kafka.common.security.plain.PlainLoginModule  required username=\"<CONFLUENT API KEY>\" password=\"<CONFLUENT API SECRET>\";"
      },
      "topic": "adsb-raw",
      "inputFormat": {
        "type": "csv",
        "findColumnsFromHeader": false,
        "columns": [
          "MT",
          "TT",
          "SID",
          "AID",
          "Hex",
          "FID",
          "DMG",
          "TMG",
          "DML",
          "TML",
          "CS",
          "Alt",
          "GS",
          "Trk",
          "Lat",
          "Lng",
          "VR",
          "Sq",
          "Alrt",
          "Emer",
          "SPI",
          "Gnd"
        ]
      },
      "useEarliestOffset": true
    },
    "tuningConfig": {
      "type": "kafka"
    },
    "dataSchema": {
      "dataSource": "adsb-raw",
      "timestampSpec": {
        "column": "!!!_no_such_column_!!!",
        "missingValue": "2010-01-01T00:00:00Z"
      },
      "transformSpec": {
        "transforms": [
          {
            "name": "__time",
            "type": "expression",
            "expression": "timestamp_parse(concat(\"DMG\", ' ', \"TMG\"), 'yyyy/M/d HH:mm:ss.SSS')"
          }
        ]
      },
      "dimensionsSpec": {
        "dimensions": [
          "MT",
          {
            "type": "long",
            "name": "TT"
          },
          {
            "type": "long",
            "name": "SID"
          },
          {
            "type": "long",
            "name": "AID"
          },
          "Hex",
          {
            "type": "long",
            "name": "FID"
          },
          "DMG",
          "TMG",
          "DML",
          "TML",
          "CS",
          {
            "type": "long",
            "name": "Alt"
          },
          {
            "type": "long",
            "name": "GS"
          },
          {
            "type": "double",
            "name": "Trk"
          },
          {
            "type": "double",
            "name": "Lat"
          },
          {
            "type": "double",
            "name": "Lng"
          },
          {
            "type": "long",
            "name": "VR"
          },
          "Sq",
          {
            "type": "long",
            "name": "Alrt"
          },
          {
            "type": "long",
            "name": "Emer"
          },
          {
            "type": "long",
            "name": "SPI"
          },
          {
            "type": "long",
            "name": "Gnd"
          }
        ]
      },
      "granularitySpec": {
        "queryGranularity": "none",
        "rollup": false,
        "segmentGranularity": "day"
      }
    }
  }
}
If you don’t have access to Confluent Cloud, you can use another Kafka service and adapt the consumer settings accordingly.
Submit the spec and wait for some data to arrive.
Logical Data Model
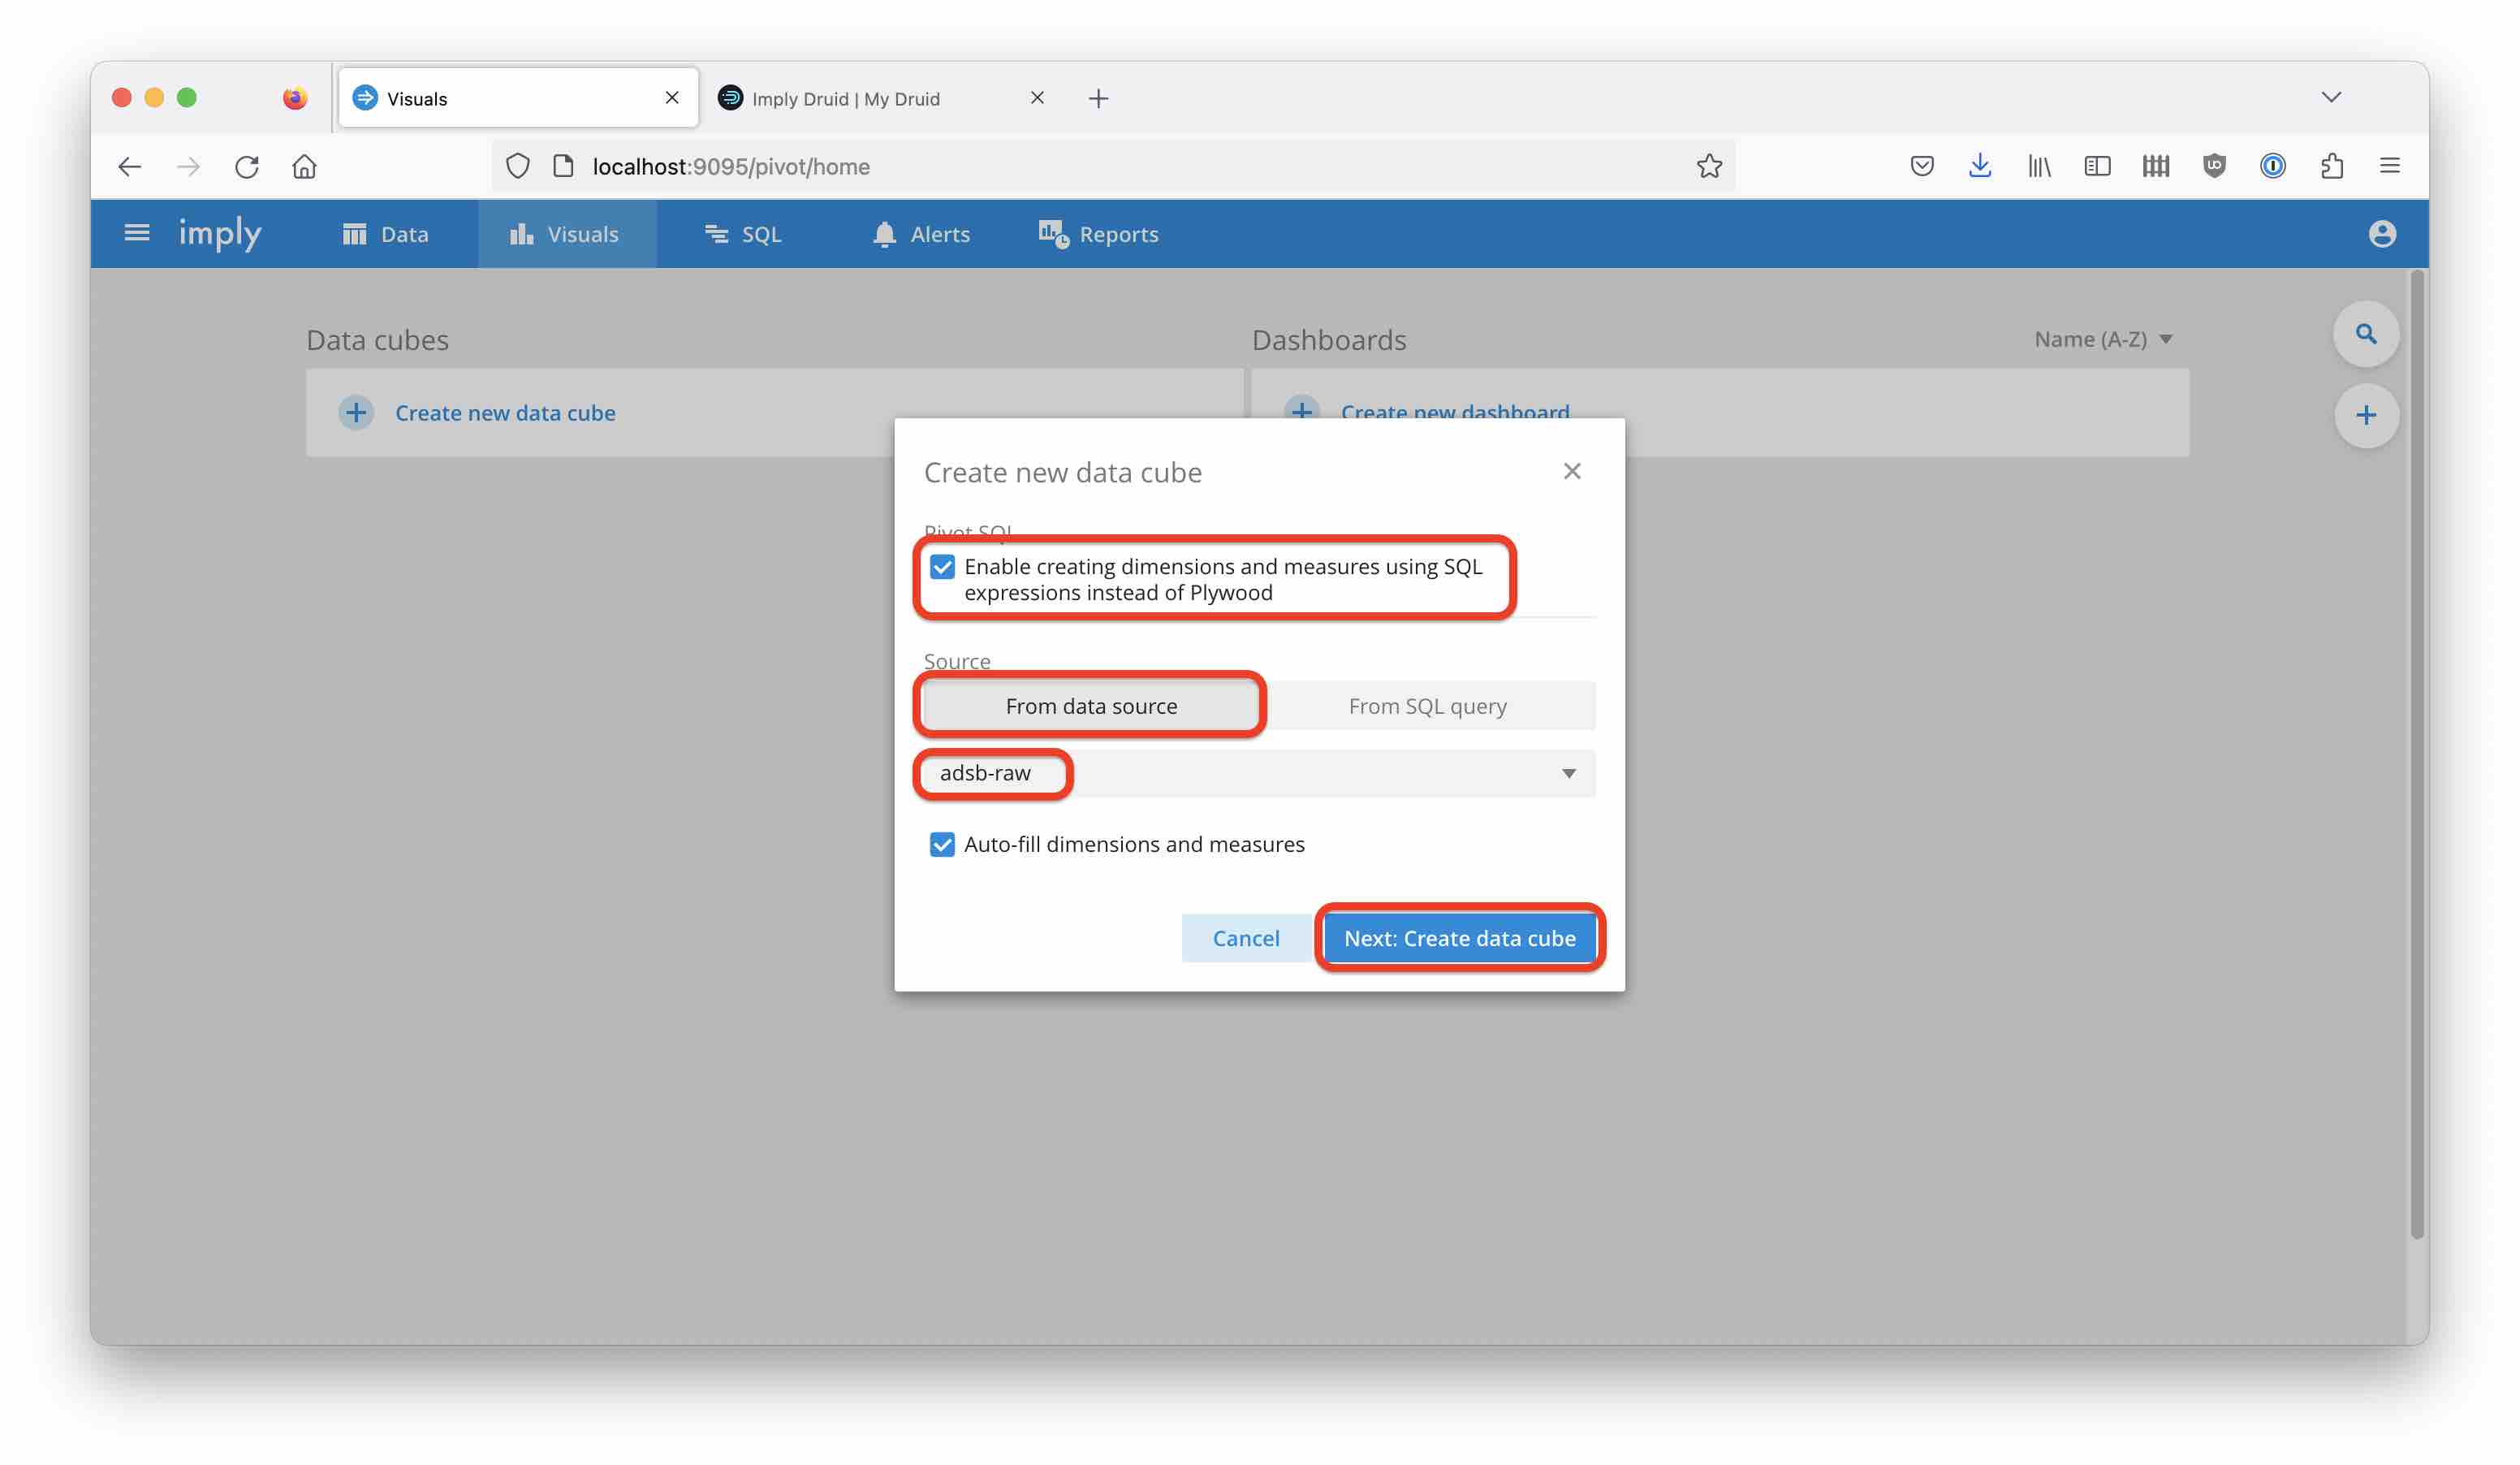
In Pivot, navigate to Visuals > Create new data cube.
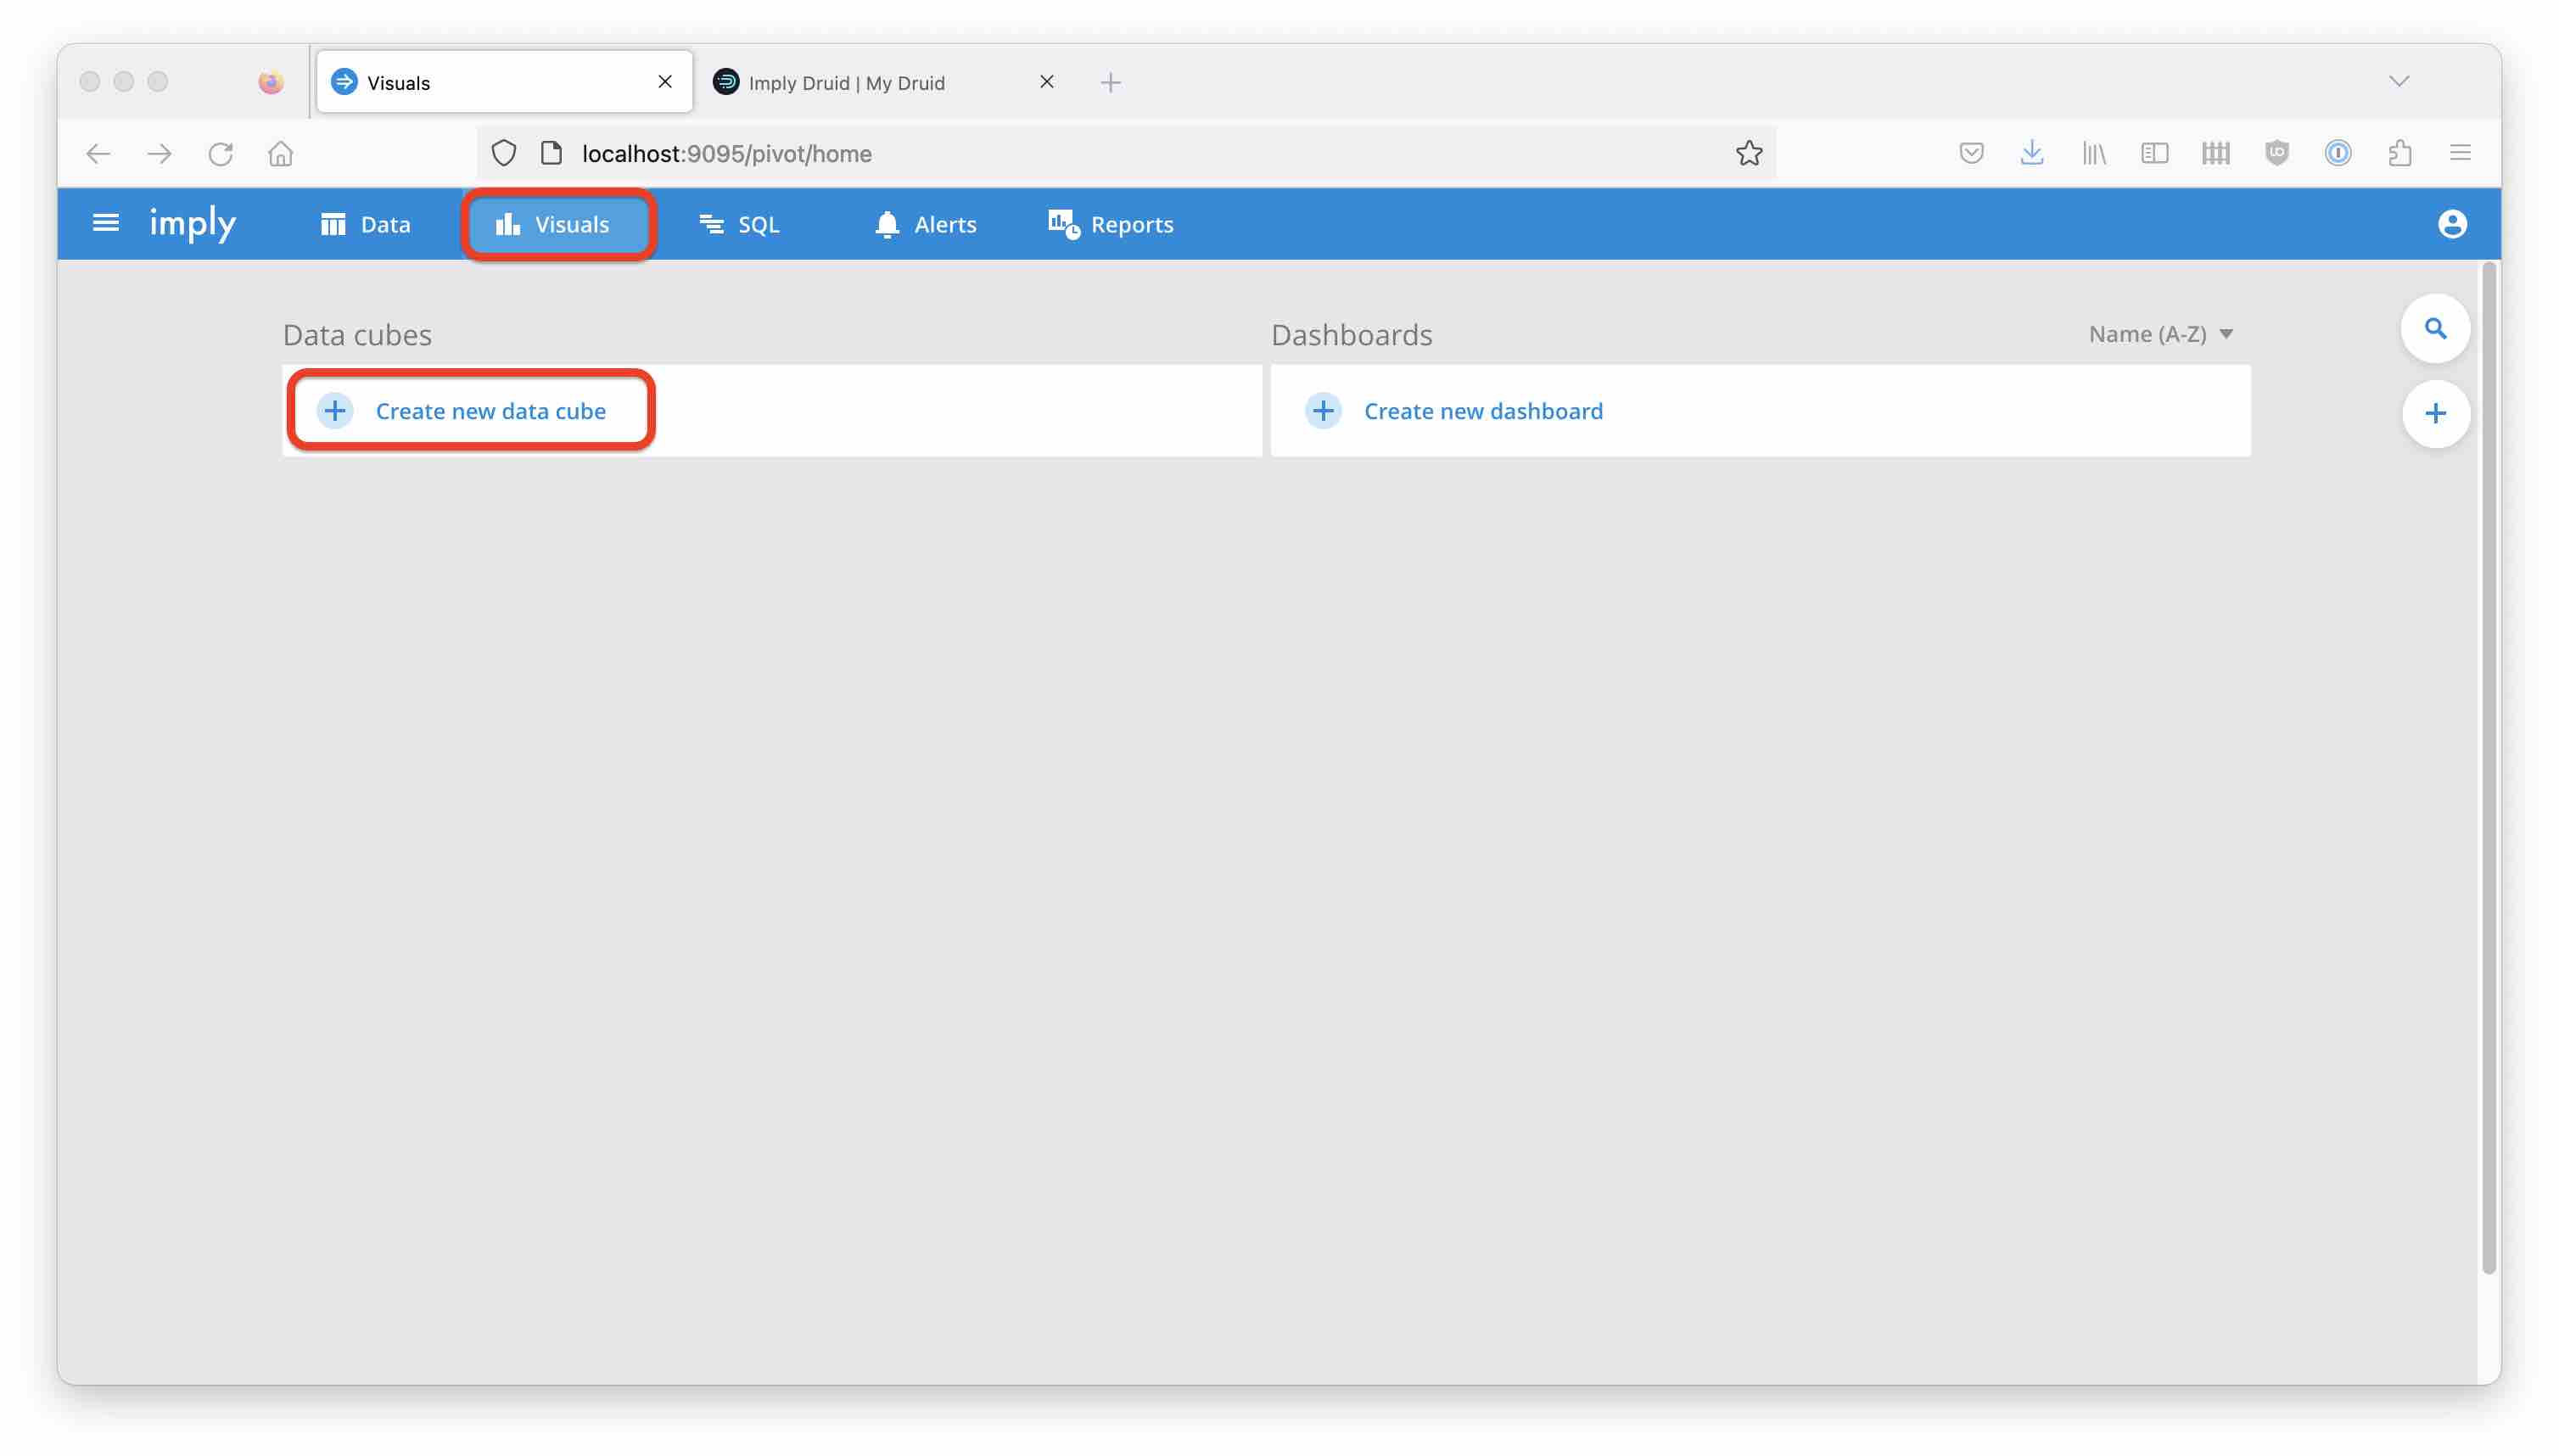
Create the cube from your new datasource, making sure that you have SQL enabled:
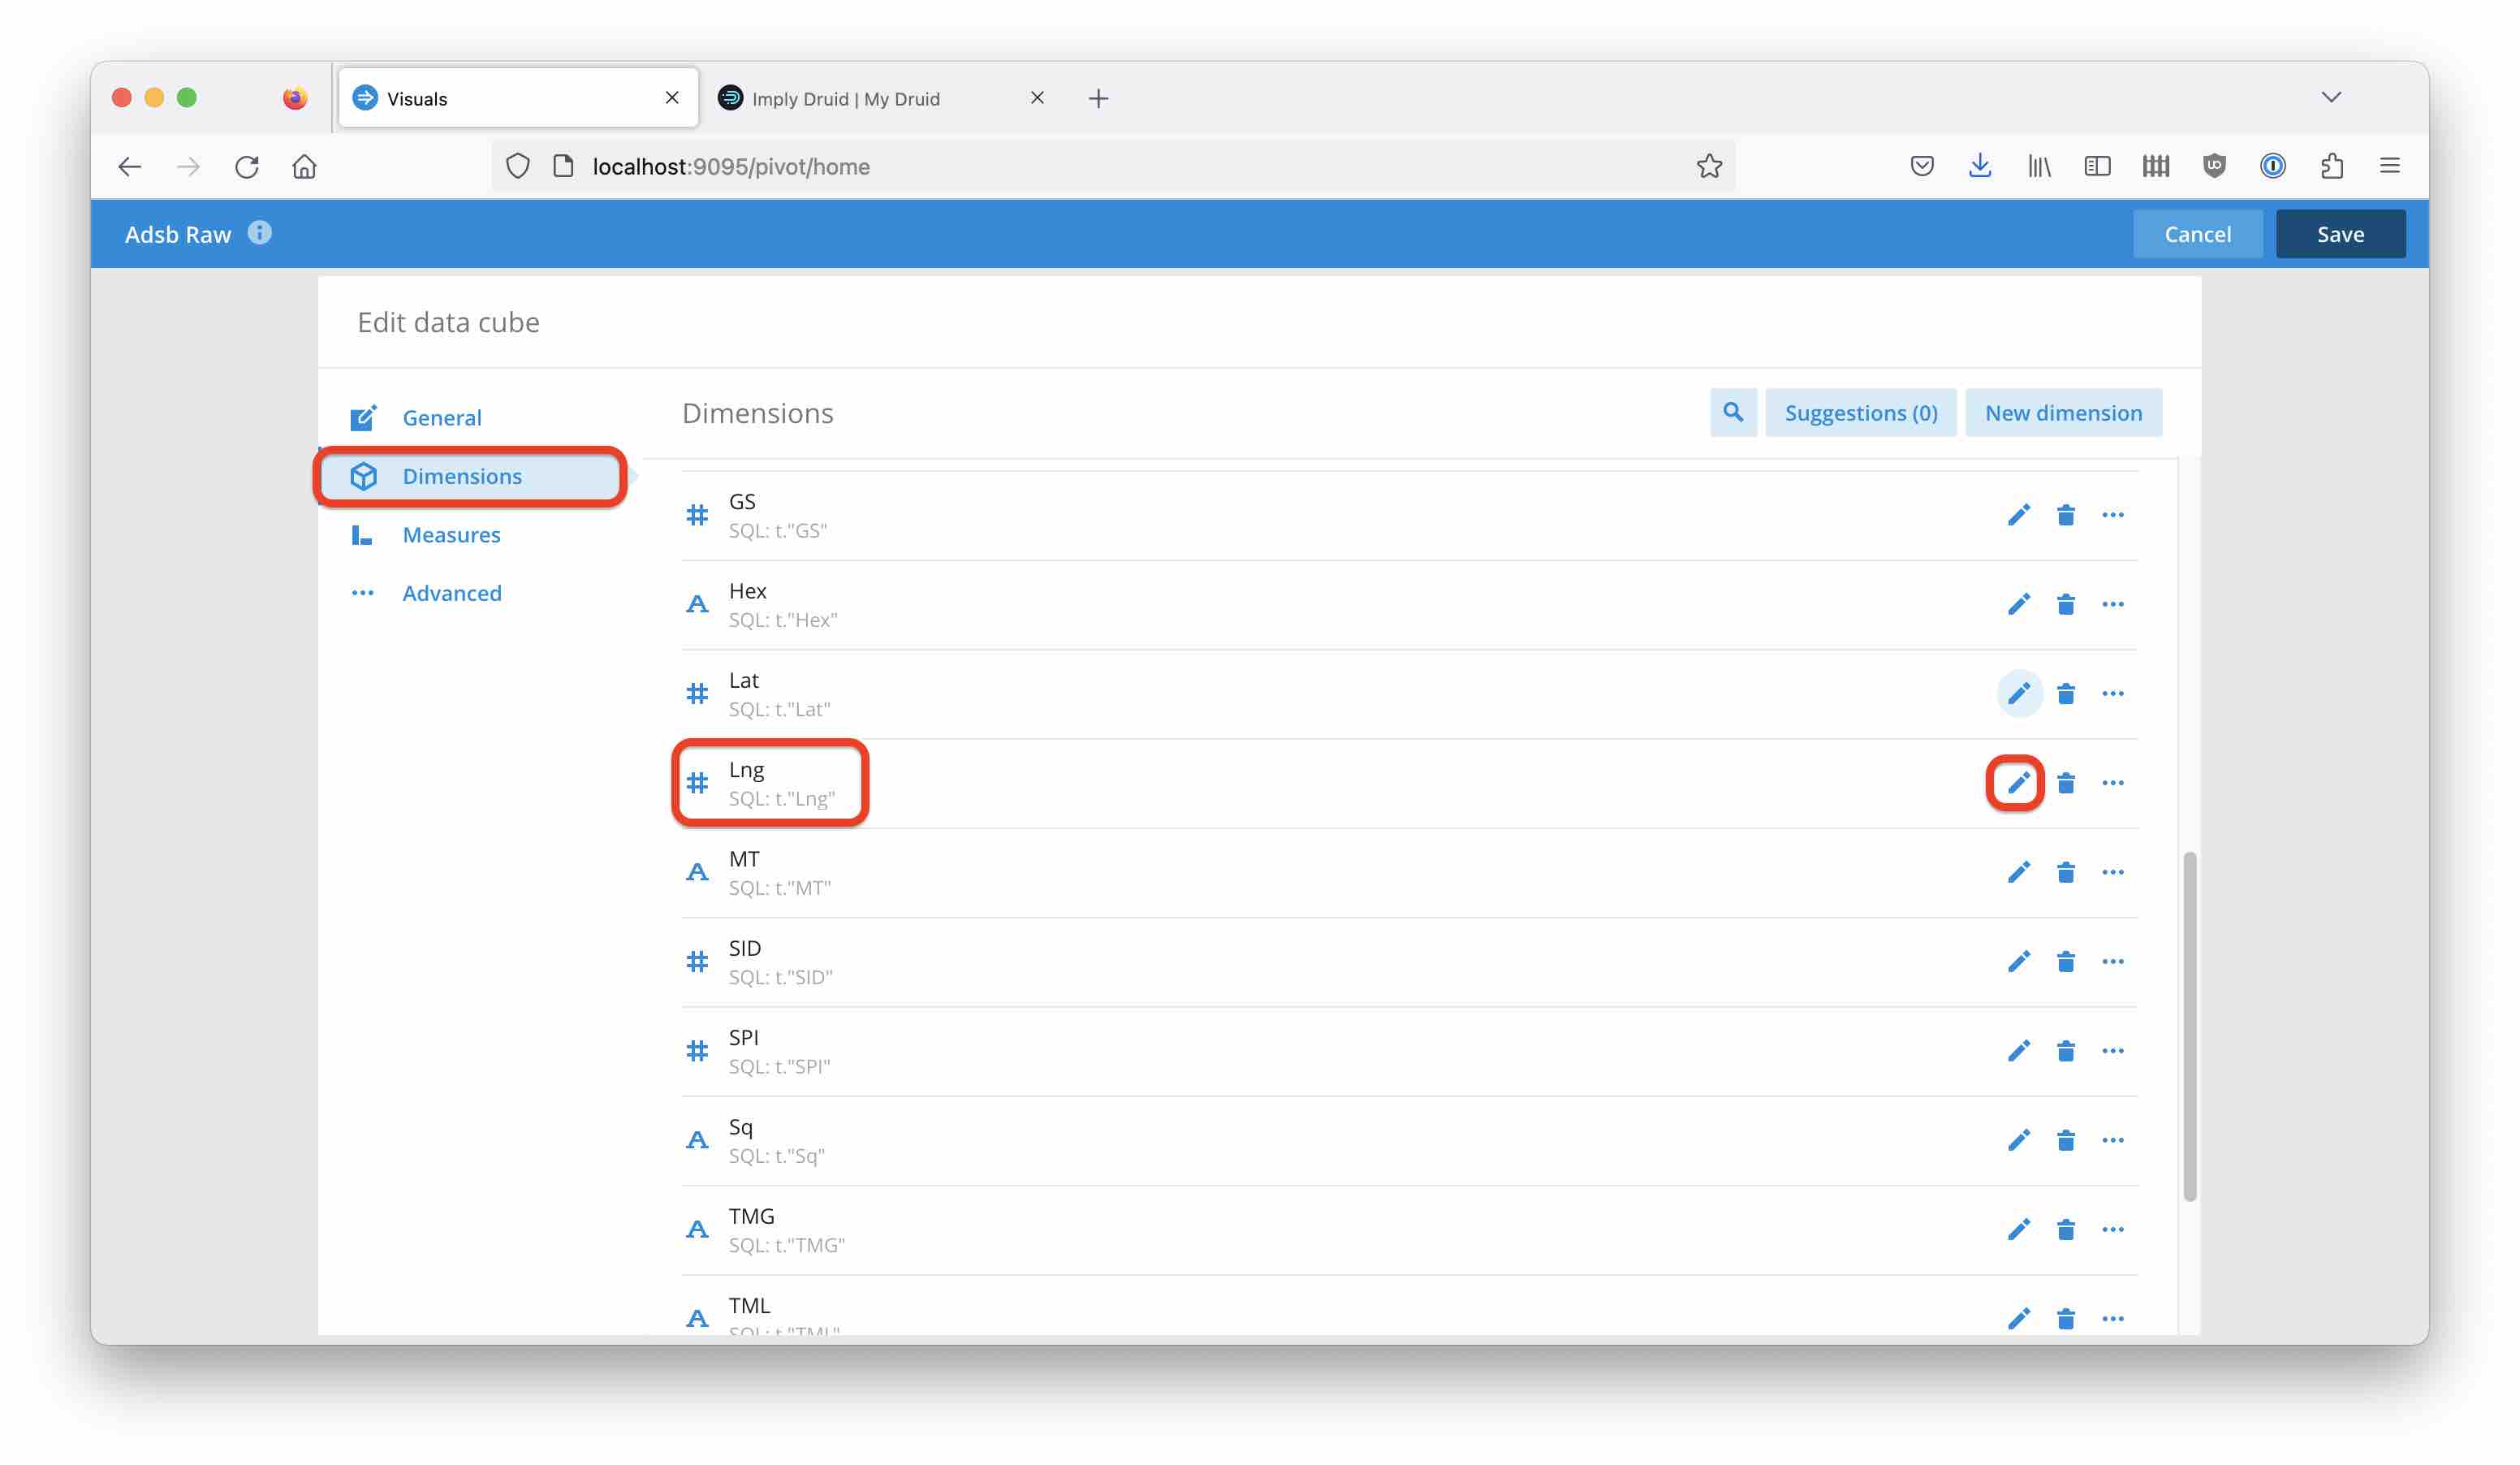
From the Dimensions menu, select the Lng dimension and edit it.
Change the dimension type to Geo and select Longitude coordinates as Geo encoding:
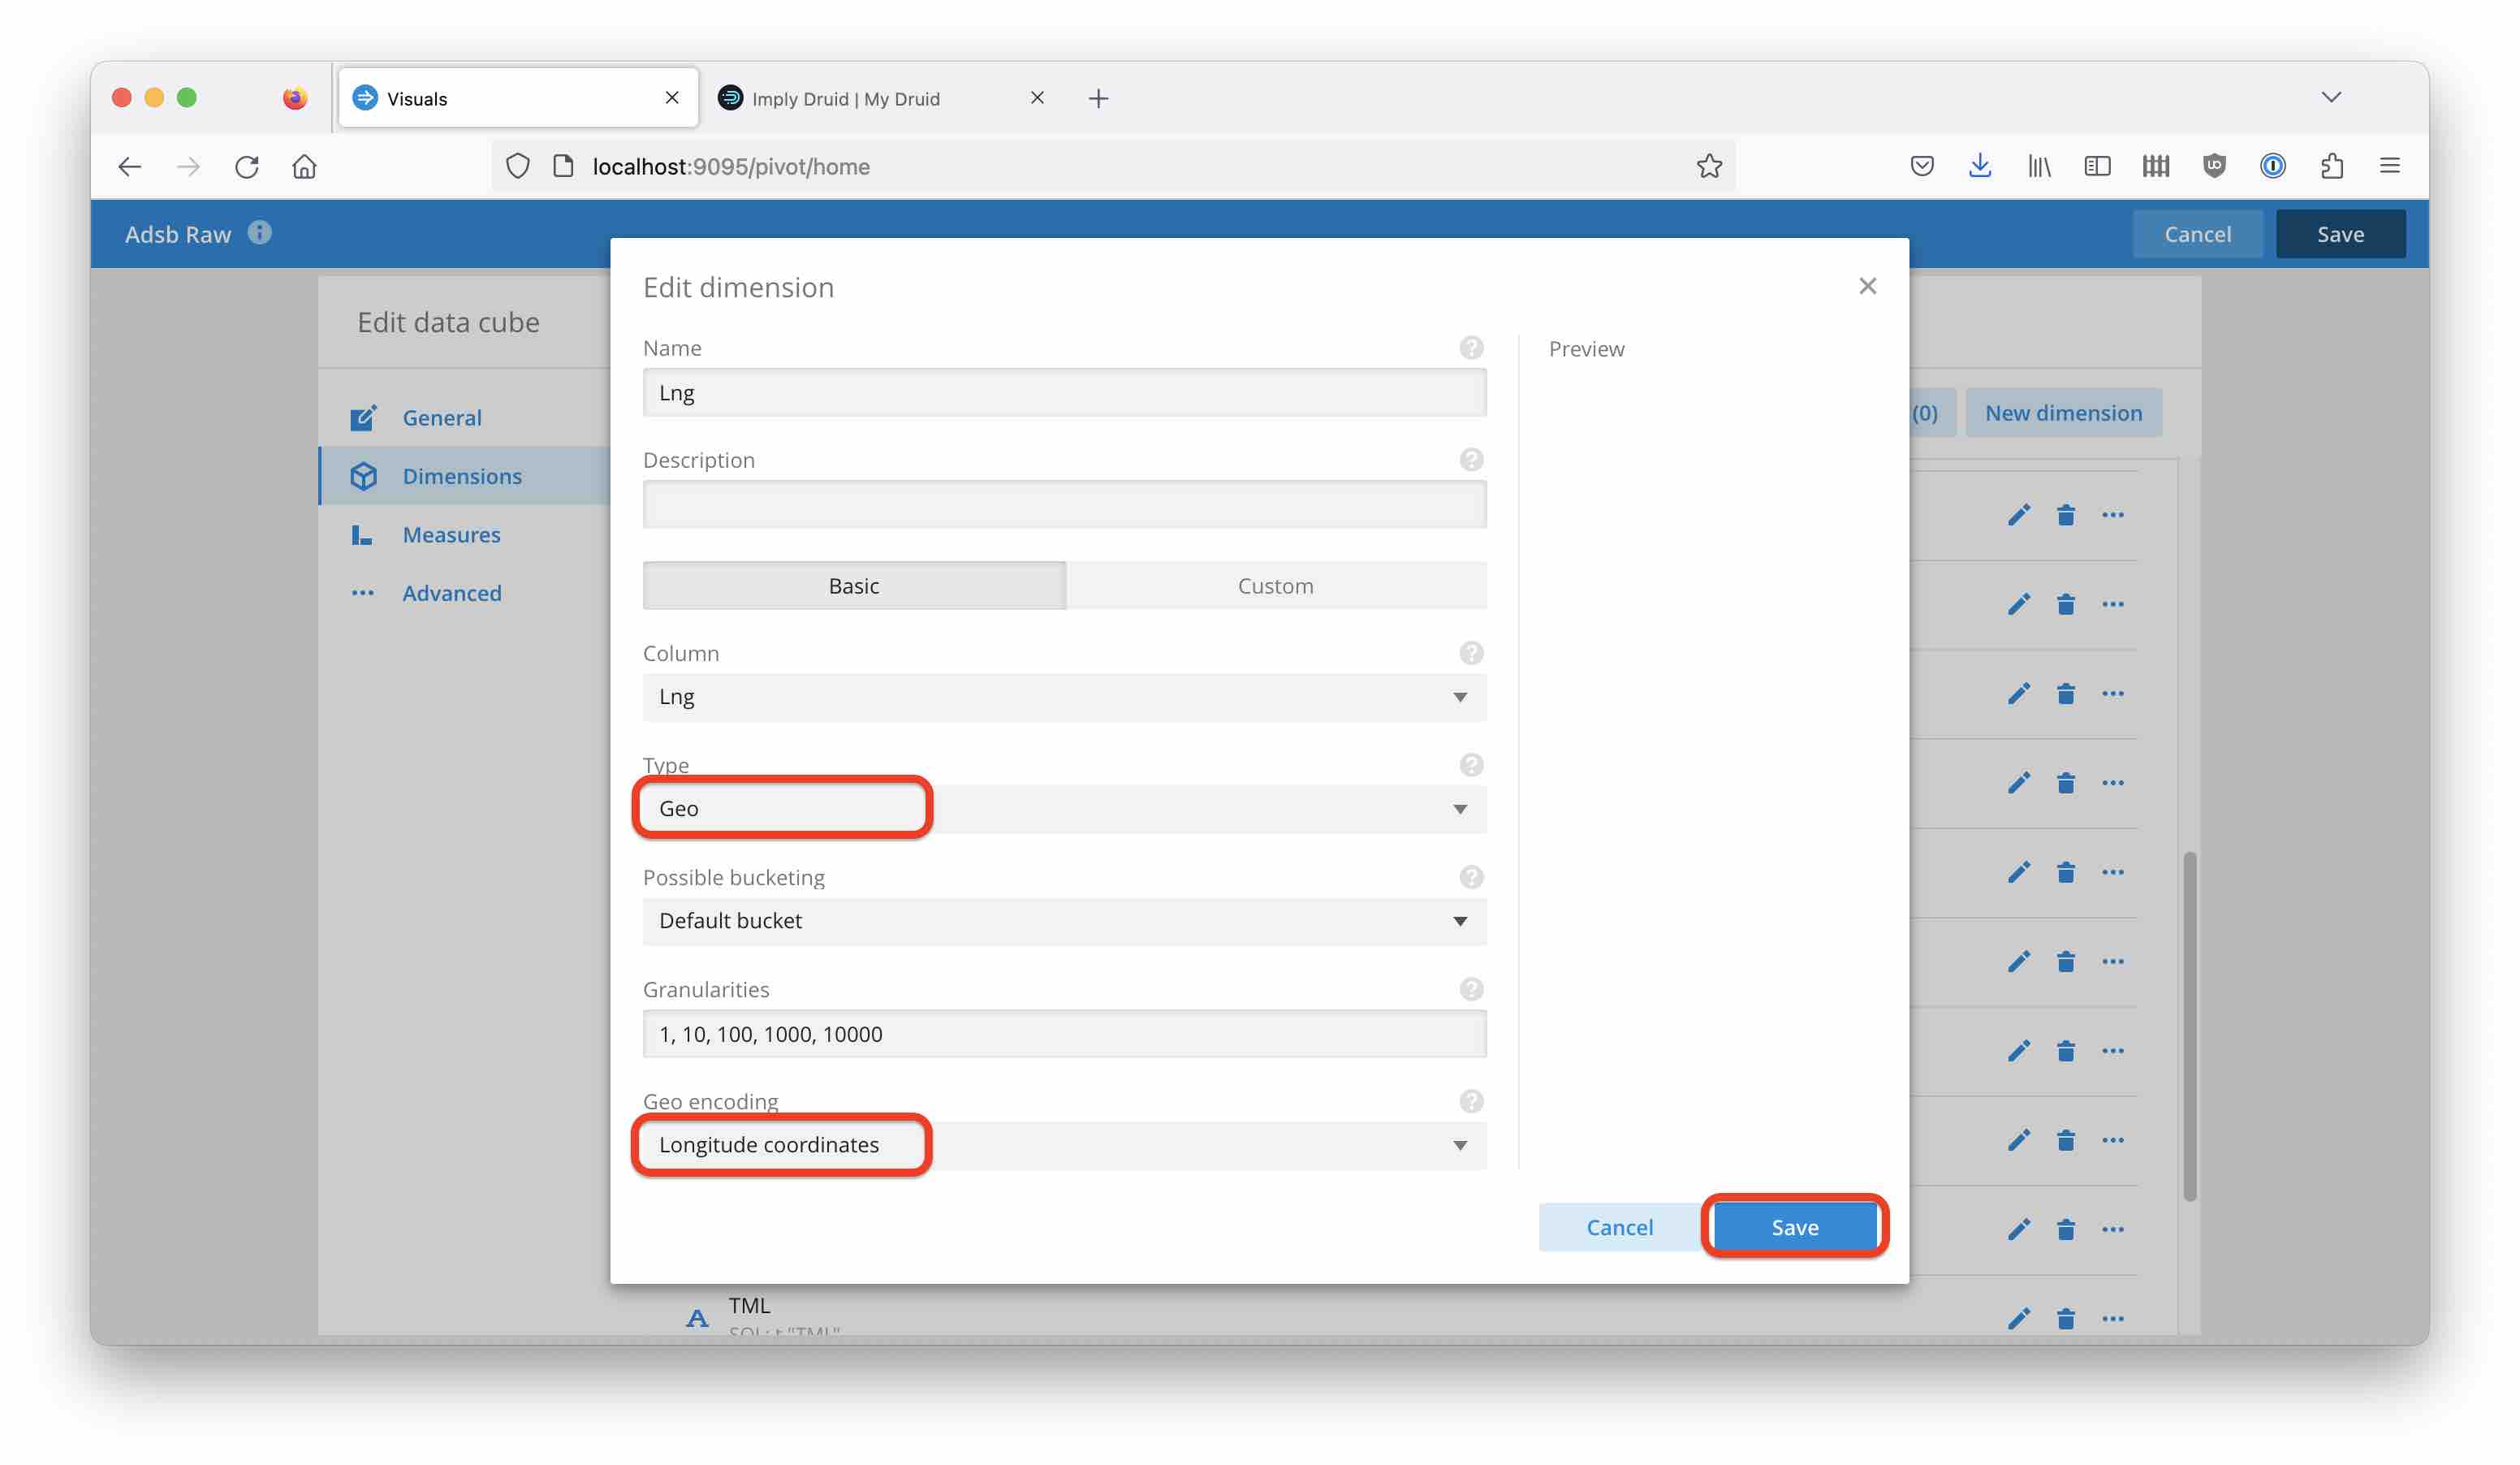
Save, and repeat the same steps for the Lat dimension, selecting Latitude coordinates.
Creating a Visualization
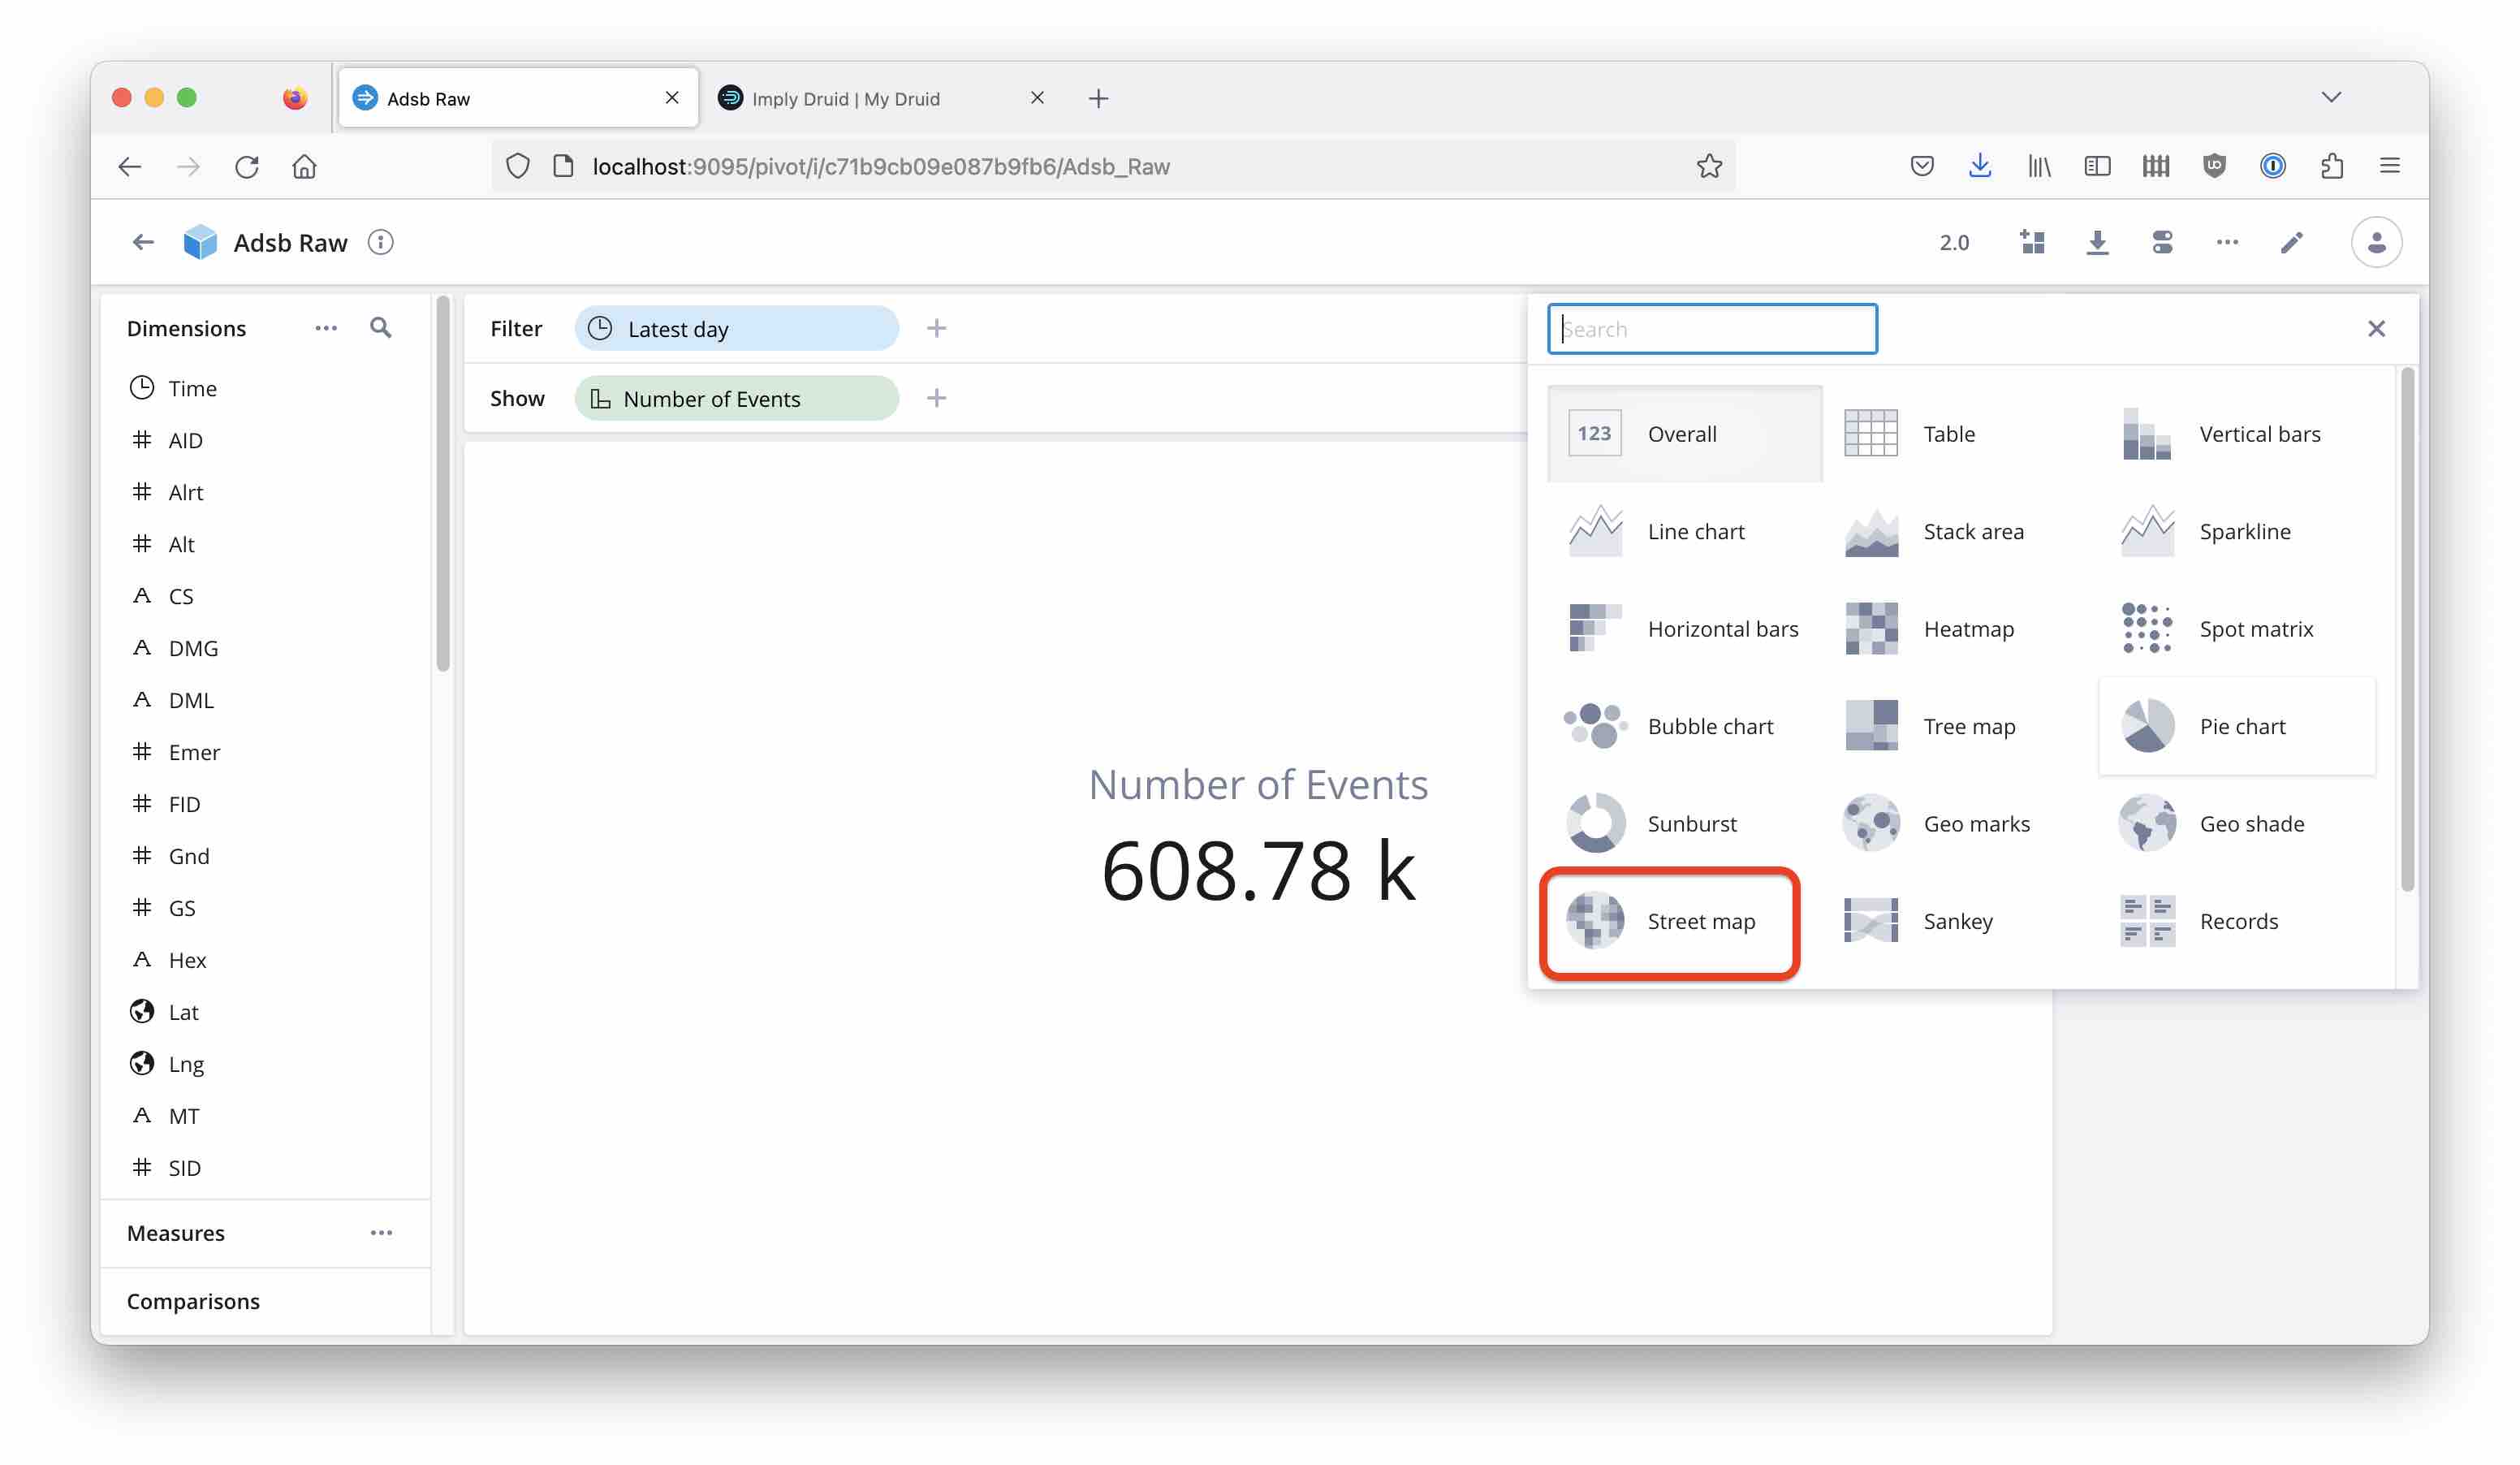
Selecting the Street Level Map
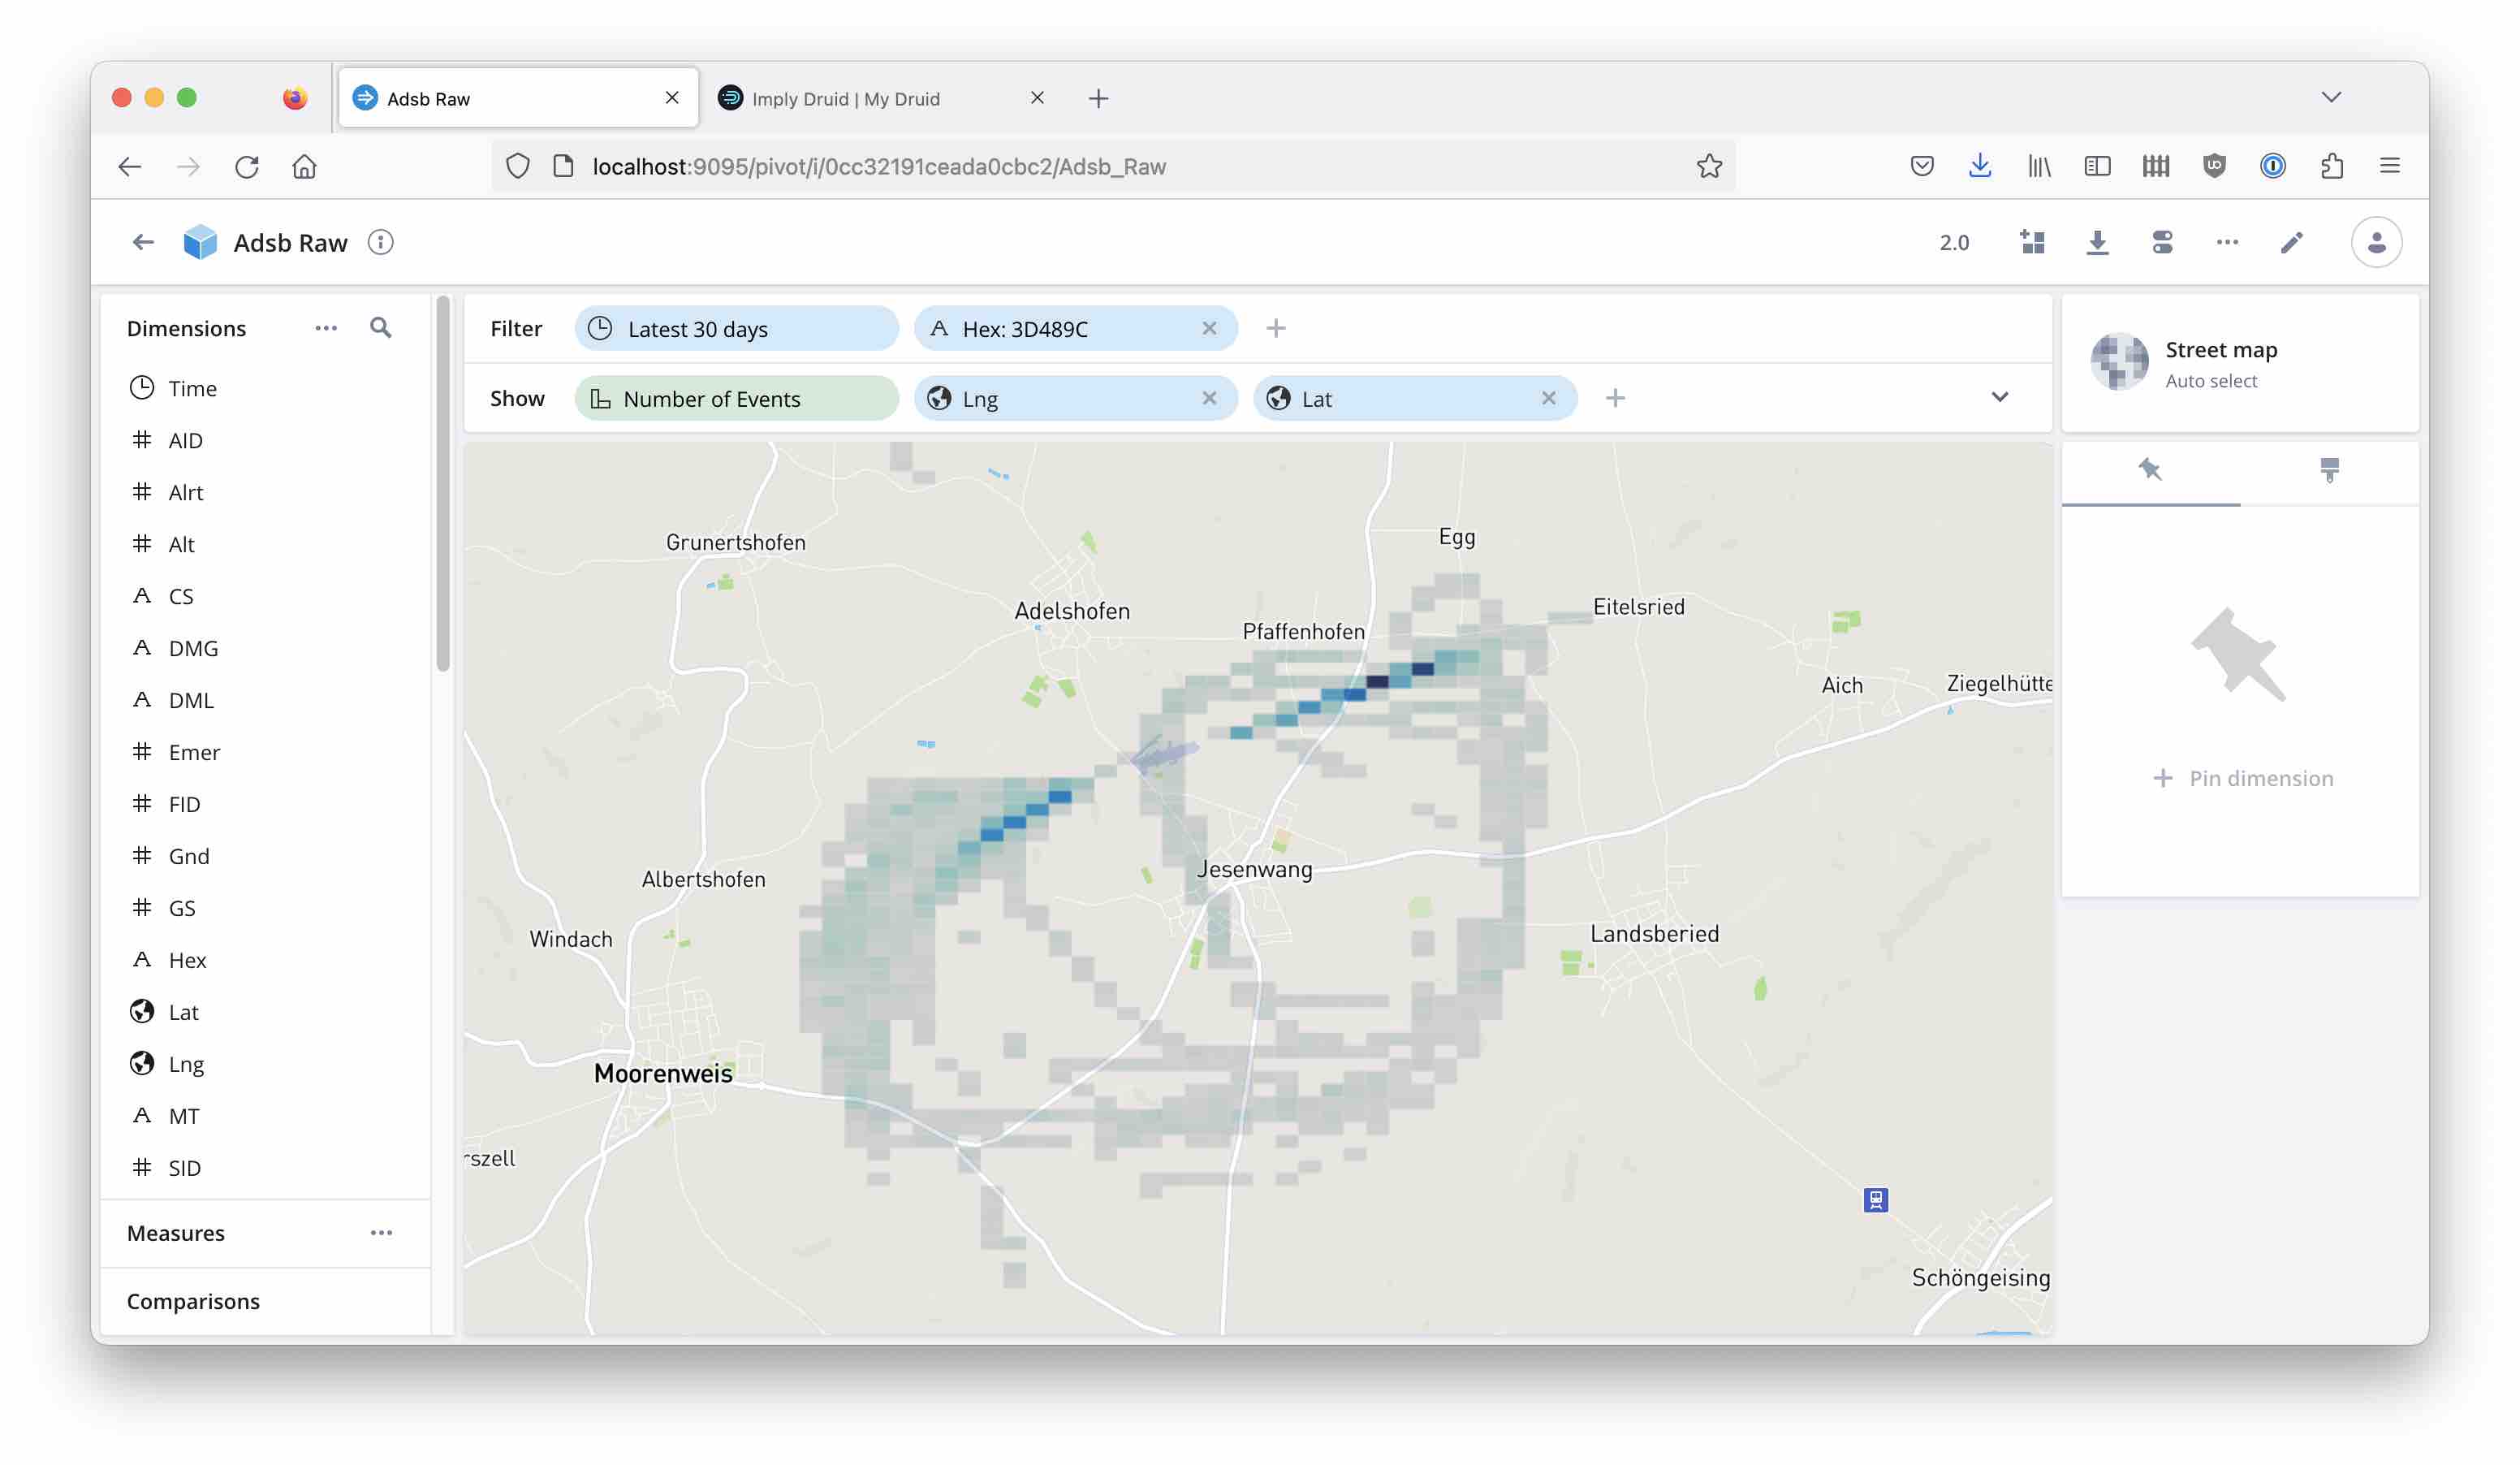
In the Pivot Cube view, select the Street map visualization:
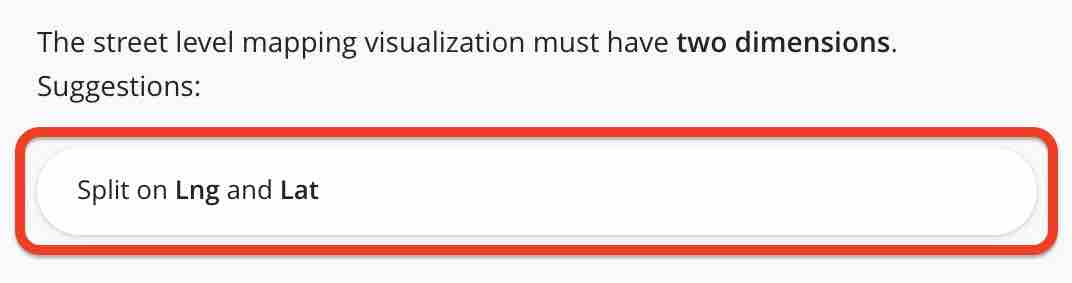
Pivot will ask you to select the dimensions to plot by, just confirm the suggestion:
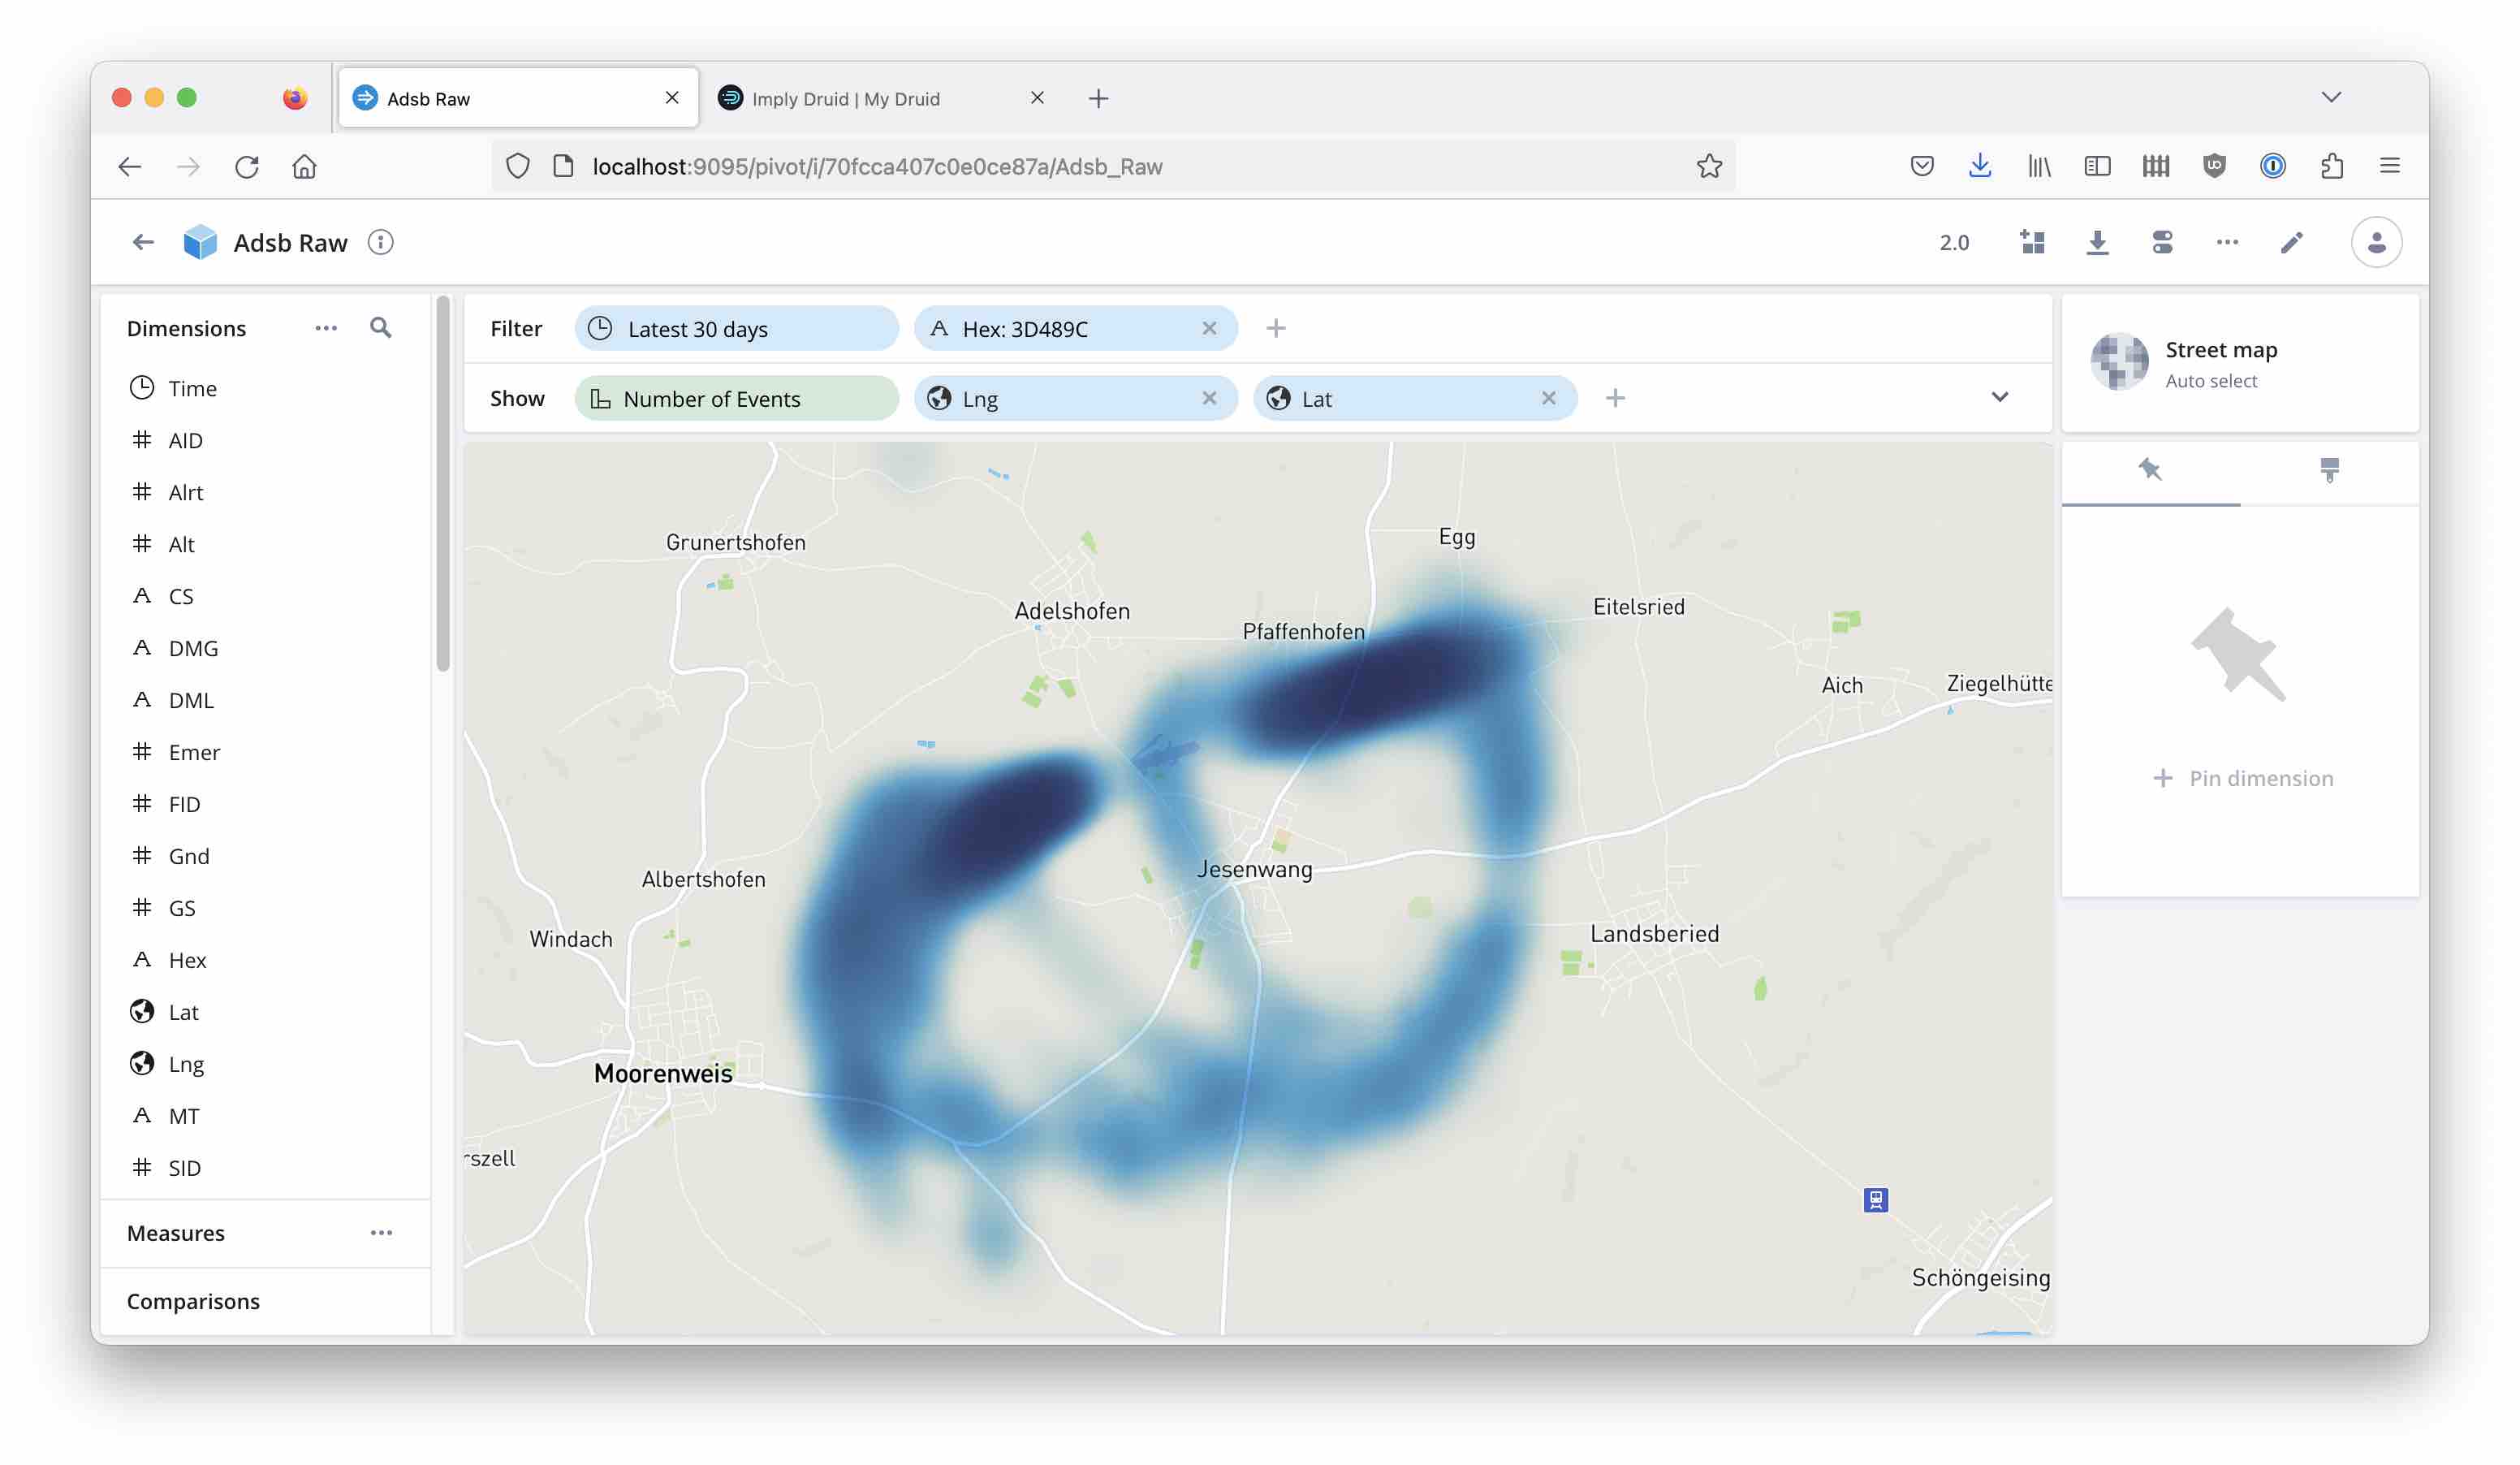
Once you do that, you will be presented with a detailed, zoomable map view! Here you can see (presumably) a private aircraft making its rounds near my town:
Configuring the Street Level Map
On the right side panel, you can find visualization options under the paintbrush panel. Here you can switch between a grid based heatmap and a more blurred view (which I prefer):
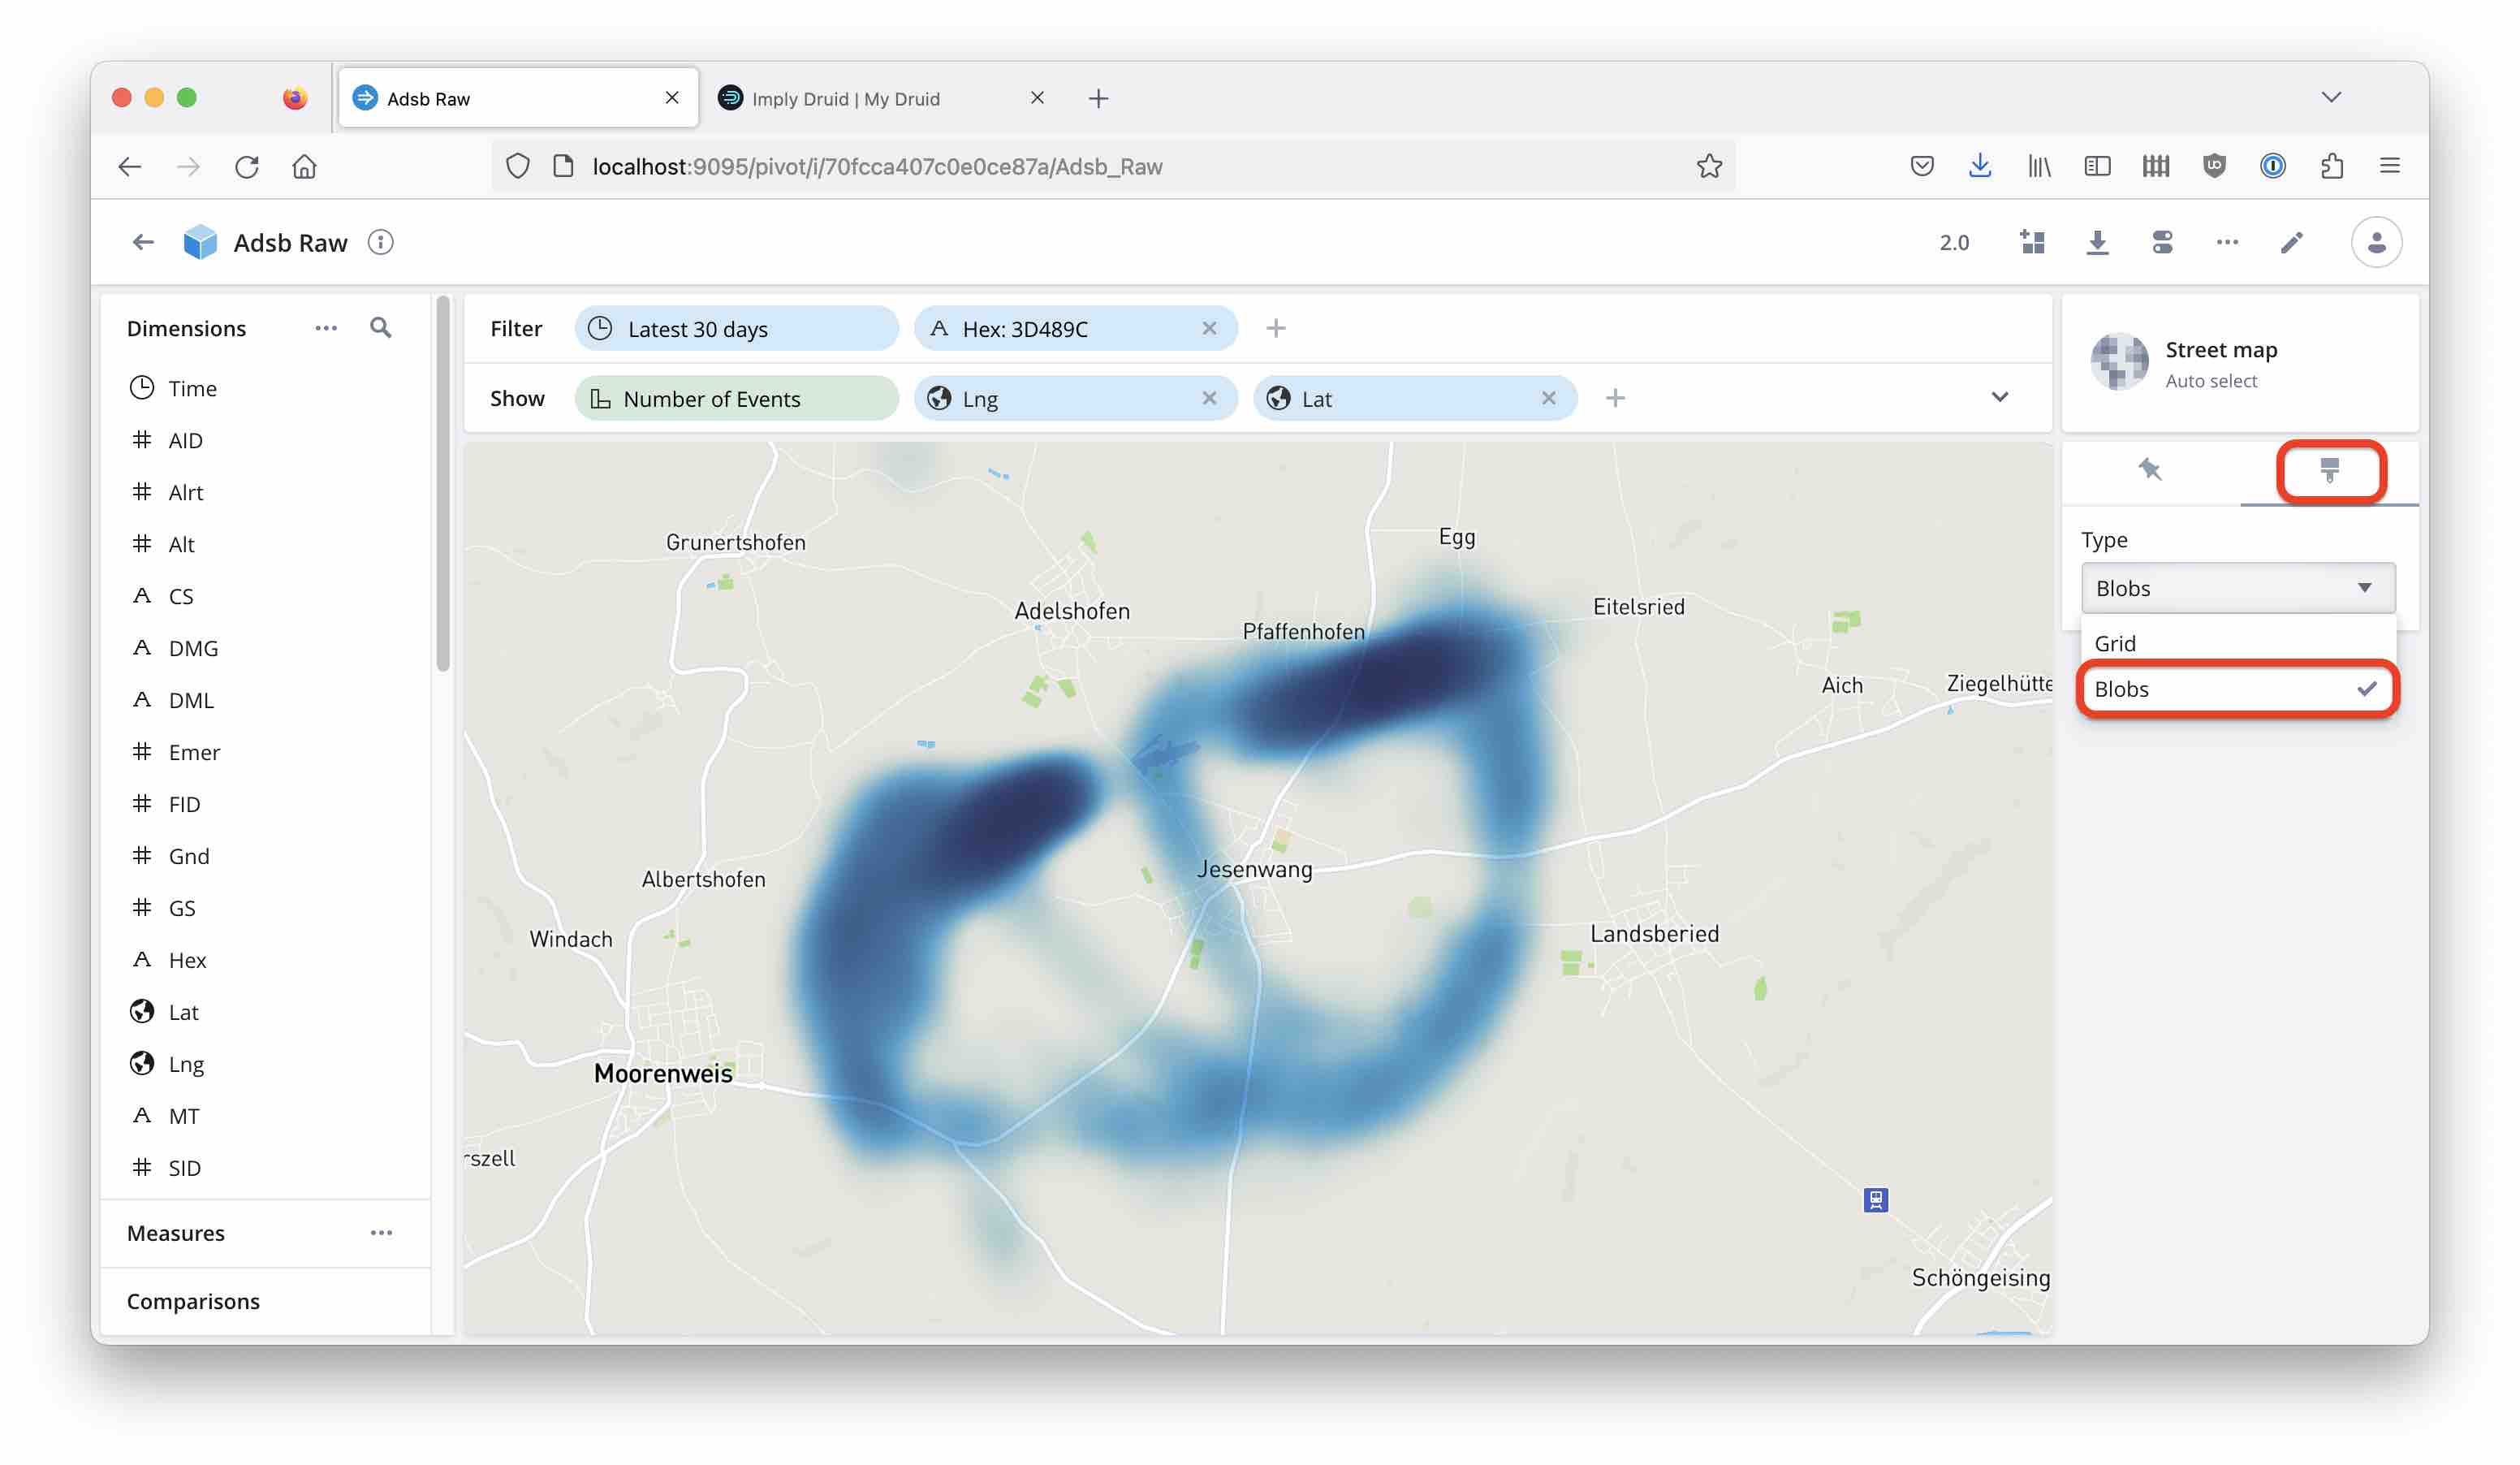
Stay tuned for more options that will be added in future versions!
Conclusion
- Imply Pivot has detailed maps now.
- With Confluent or Kafka, this enables new use cases - real time visualization of data such as traffic or deliveries on a detailed map is easy.
- You need to bring your own MapBox API key, and you need to enable a feature flag to try this out.
- The street level map view is based on longitude and latitude coordinates.